- Uncategorized
Four ways GFW just became more useful
Sep 10, 2014||7 minutes
Demonstrating the new Tree Canopy Cover Threshold Tool in Russia
By Benjamin Jones and Alyssa Barrett This week has brought some major new upgrades to Global Forest Watch, including advanced user capabilities and better visualizations. Where did we get the idea to make these upgrades? From you! Since our launch in February, you have shared your feedback with us, and we have made responding to it a top priority. Read on to learn about the new features and find out how you helped improve GFW.
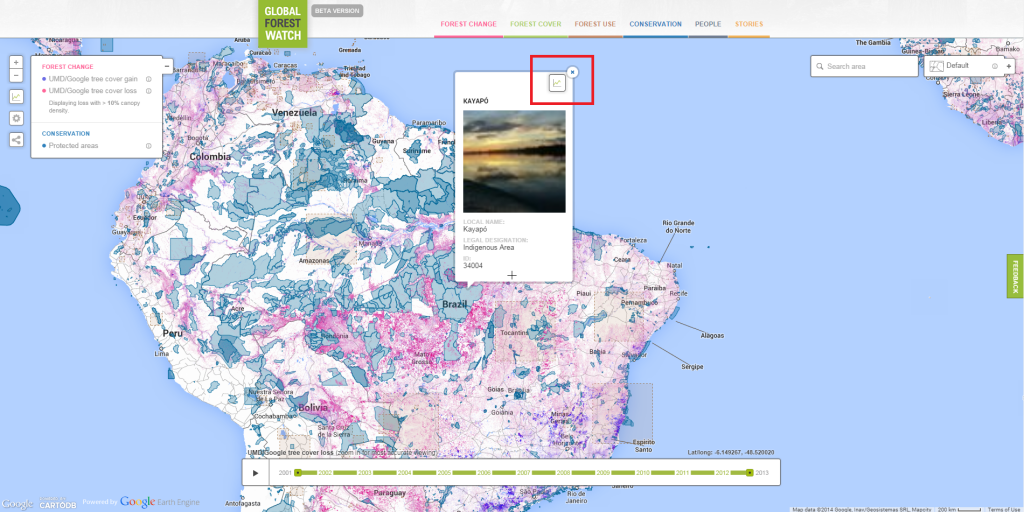
1. Visualize the geographic “intensity” of UMD/Google tree cover loss, gain, and extent
If you are a frequent visitor to GFW, you’ll notice a visible change to the default UMD/Google tree cover change data when you first enter the map. Instead of the usual flat pink, blue, or green pixels, you will now see the data graded by transparency, from soft brushes of color in areas with a low density of pixels to bright splotches of color where the data are intensely concentrated. Pixels of loss, gain, and extent are now displayed on an “opacity ramp,” which matches the intensity of the color to the geographic density of the pixels present. This allows users to easily spot areas of dense tree cover (e.g., the Amazon or Congo basins), areas of highly concentrated loss (e.g., areas of extensive forest fires in Siberia and Canada or wide-scale forest clearing in Indonesia), and areas of widespread tree cover gain (e.g., regrowth in the Southeast U.S.) This variation in opacity is only visible at low zoom levels (i.e., when you are zoomed out). Once you zoom into the map and the data is at full resolution (zoom level 13 for this data) there will be no variation in opacity–pixels are either present or absent. This is why we recommend zooming in for greater accuracy.
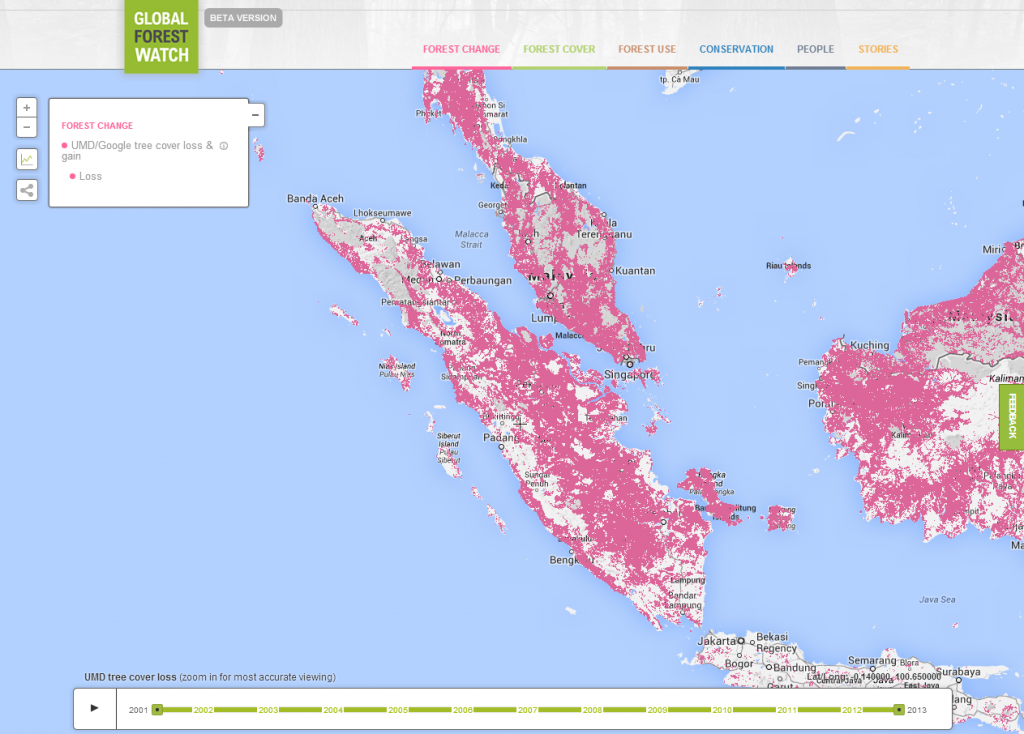 Original: UMD/Google tree cover loss without geographic intensity.
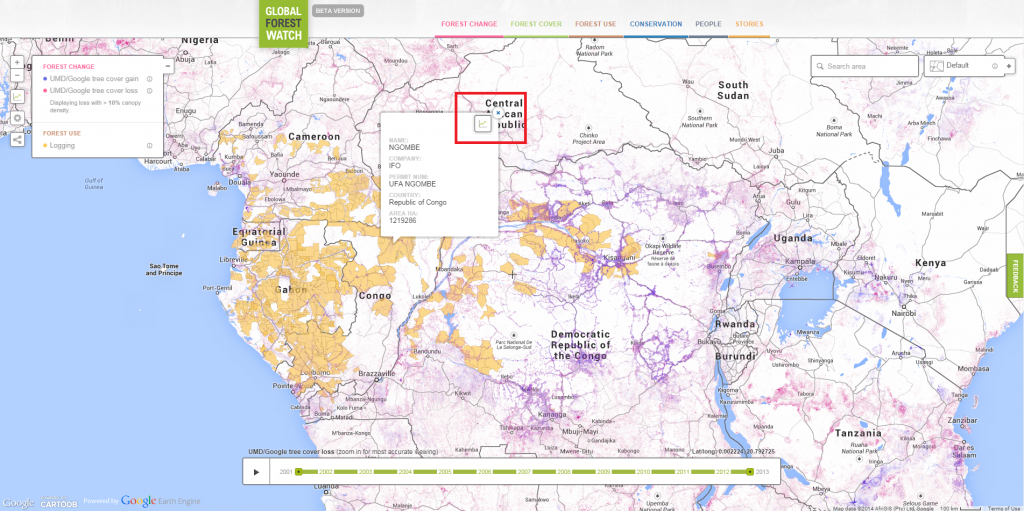
 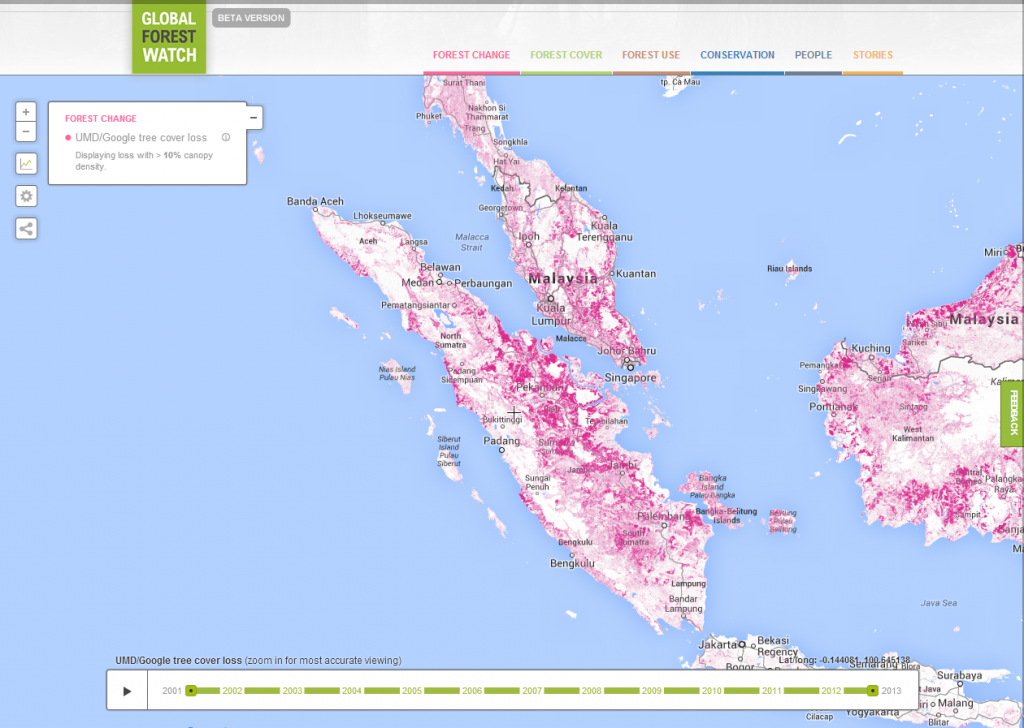 Updated: UMD/Google tree cover loss with geographic intensity.
 It is also worth noting that we improved how the time slider visualizes annual changes in UMD/ Google tree cover loss at low zoom levels (i.e., zoomed out). At low zoom levels one pixel on the map is actually an aggregation of multiple, smaller pixels that don’t appear until you zoom in. Previously, the larger pixel that is an aggregation of smaller pixels turned pink in the first year one of the smaller interior pixels lost its tree cover. Even if 99% of the smaller pixels lost tree cover in 2005 and only 1% of pixels lost tree cover in 2002, the entire larger pixel turned pink in 2002. Now that larger pixel turns pink in the mode (most common) loss year of the smaller, interior pixels–2005 in this example. As a result, the time slider gives a smoother- and likely more accurate- representation of when loss occurred in an area.
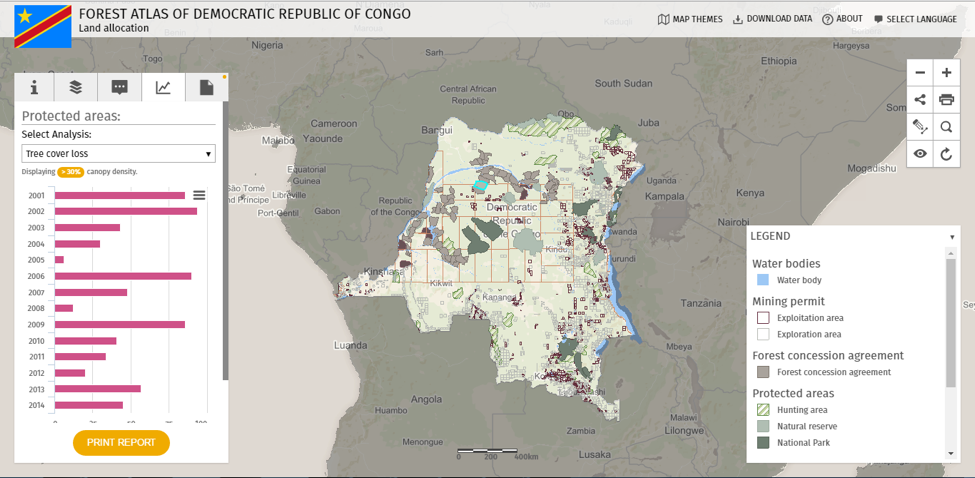
2. Filter by tree cover canopy density for UMD/Google tree cover loss and tree cover extent data
Not all forests have the same footprint. Some forests are dense, like the tropical Amazon, with canopies that blanket almost every inch of ground for miles. Others forests are sparse, such as the savannah woodlands of North Africa where the canopies do not close or interlace. There are many shades in between. As a result, there is no consensus among countries or scientists on how much tree cover is needed to constitute a “forest.” Some countries define “forests” as wooded areas with a canopy density greater than 10%, whereas others apply a much higher threshold, such as 30%. Now for the first time, GFW allows you to adjust key data- tree cover loss and tree cover extent- to your preferred threshold for tree cover canopy density, depending on your national standards or ecosystem type. Here’s how to access and use this new “settings” feature:
- Map. When viewing tree cover loss and extent on the map you can now view data by canopy density thresholds >10%, >15%, >20%, >25%, >30%, >50%, and >75% by clicking on the gear icon located on the left-hand side of the map. To be inclusive, we’ve made the default tree cover canopy density >10%. As you change the threshold, you will notice great variation in regions containing dryland forests.
- Analysis. The analysis tool within the map matches the tree cover canopy density you select in the settings window. For example, if you decide to view data at a threshold of >25% and then perform an analysis of tree cover loss, the resulting figure will only capture loss that occurred in pixels that originally had a >25% threshold for tree cover canopy density.
- Country pages. Users now have the option to change the tree cover canopy threshold for UMD/Google-sourced statistics in the GFW country pages, which are featured in a new design at the top of the page. As the map, the default threshold is >10%. Right away, you may notice that the numerical figures for tree cover loss and extent look very different from the old site, and that’s because they are! Before this update, the tree cover canopy threshold was set at >0% for tree cover loss and at >25% for tree cover extent. For some countries, adjusting the threshold can cause a dramatic change. You can adjust the threshold through the “settings” button on the right-hand side of the page. In addition, when you click “analyze” within the country pages, the analysis (and map visualization) will reflect the threshold selected within the country page settings.
- Global overview page. Similar to the country pages, users can now also change the tree cover canopy threshold within the global overview page. Adjustments made through the “settings” button on the top of the page affect the graphs as well as the country rankings. As you adjust the settings, you may notice significant changes in rankings resulting from the differences in the tree cover canopy density of the forests within each country.
Note: The setting to adjust the tree cover canopy threshold does not apply for tree cover gain, as tree regrowth takes a long time to register on satellite images and there has been no recent assessment of canopy density from regrowth. 3. Enhanced analysis functionality
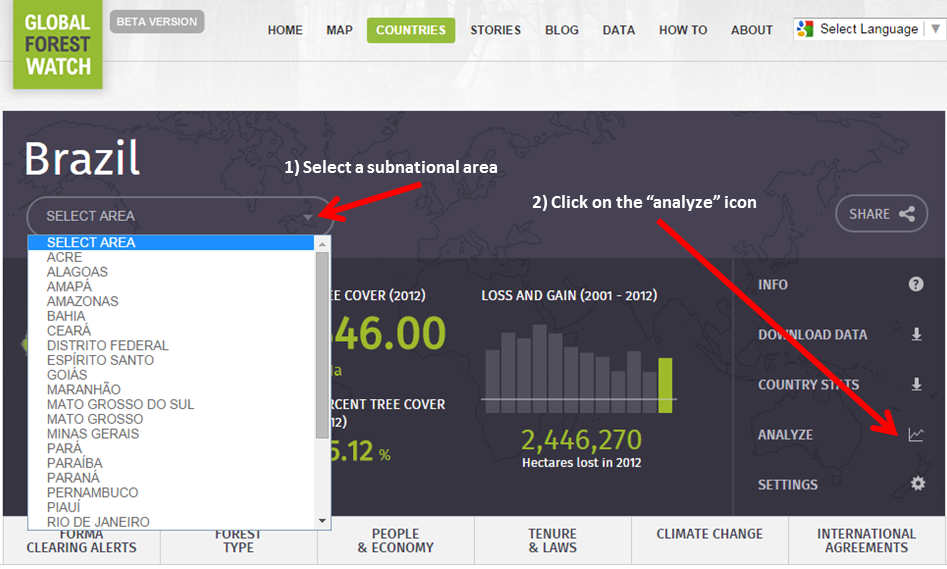
Local communities, commodity buyers, governments, and other users need tools to monitor forest change within their areas of interest, such as concessions and protected areas. Thanks to recent upgrades, GFW is just the tool for the job. GFW now supports the following types of analysis:
- Analyze key data for a subnational area, such as a region, state, or province. Applies to UMD/Google tree cover loss and gain, FORMA alerts, Imazon SAD alerts, QUICC alerts, and NASA active fires.
- Analyze key data for a protected area, such as a national park or conservation area. Applies to FORMA alerts, Imazon SAD alerts, QUICC alerts, and NASA active fires (soon to be expanded to UMD/Google tree cover loss, gain, and extent).
- Analyze key data for a forest use area, such as a concession for oil palm, timber, wood fiber, or mining. Applies to FORMA alerts, Imazon SAD alerts, QUICC alerts, and NASA active fires (soon to be expanded to UMD/Google tree cover loss, gain, and extent).
Users can also always draw their own polygon for analysis. Stay tuned for future enhancements to the analysis tool as we continue to add new data and functions.
4. Smoother map and time slider operation and fewer bugs
At GFW, we recognize that website glitches and bugs not only detract from a user’s experience, but they reduce the utility of a website. To ensure bugs and erratic site behavior aren’t diminishing GFW’s utility, we restructured the website’s code to be simpler and more testable. Although this upgrade is mostly “under the hood,” you may notice smoother operation of the map and time sliders, fewer bugs, and an all-around better website! We are always working to make GFW better for you. If you have any questions, or want to provide feedback about these upgrades, please feel free to reach out to the GFW team, at gfw@wri.org. We’d love to hear from you!
Explore More Articles
Jun 05, 2017|Uncategorized|1 minute
UPDATE: High-resolution satellite imagery is back on GFW
Since March, high resolution satellite imagery has been unavailable on Global Forest Watch while we switched service providers from UrtheCast to Sentinel Hub to ensure continued global coverage. We wanted to thank you for your patience during this process, and update you with the exciting news that you can now once again access high-resolution satellite imagery on GFW! View this spot on the GFW interactive map. Sentinel Hub provides the latest Landsat 8 and Sentinel 2 […]
Apr 26, 2017|Uncategorized|2 minutes
UPDATE: GLAD deforestation alerts temporarily on hold
As you may have noticed, the GLAD deforestation alerts have not updated for several weeks. We wanted to thank you for your patience and give you the latest on when the alerts are expected to be back online. When will GLAD alerts be back? The team at University of Maryland’s Global Land Analysis & Discovery […]
Sep 19, 2016|Uncategorized|4 minutes
Customizing GFW made easy with Map Builder
By Thomas Maschler and Asa Strong WATCH OUR WEBINAR to learn how to use GFW Map Builder Open data enables communities and decisions makers around the world to engage in important societal and environmental issues. It increases transparency and informs actions that often affect livelihoods. But simply making data ‘open’ doesn’t guarantee change. To drive […]


