- Data
PARTNER POST: Five Percent of Canada’s Pristine Forests are Fragmented or Degraded, Affecting Up to Six Endangered Species
Aug 16, 2016||4 minutes
unknown
By Wynet Smith and Ryan Cheng
Find out more about Global Forest Watch Canada’s IFL data methodology here.
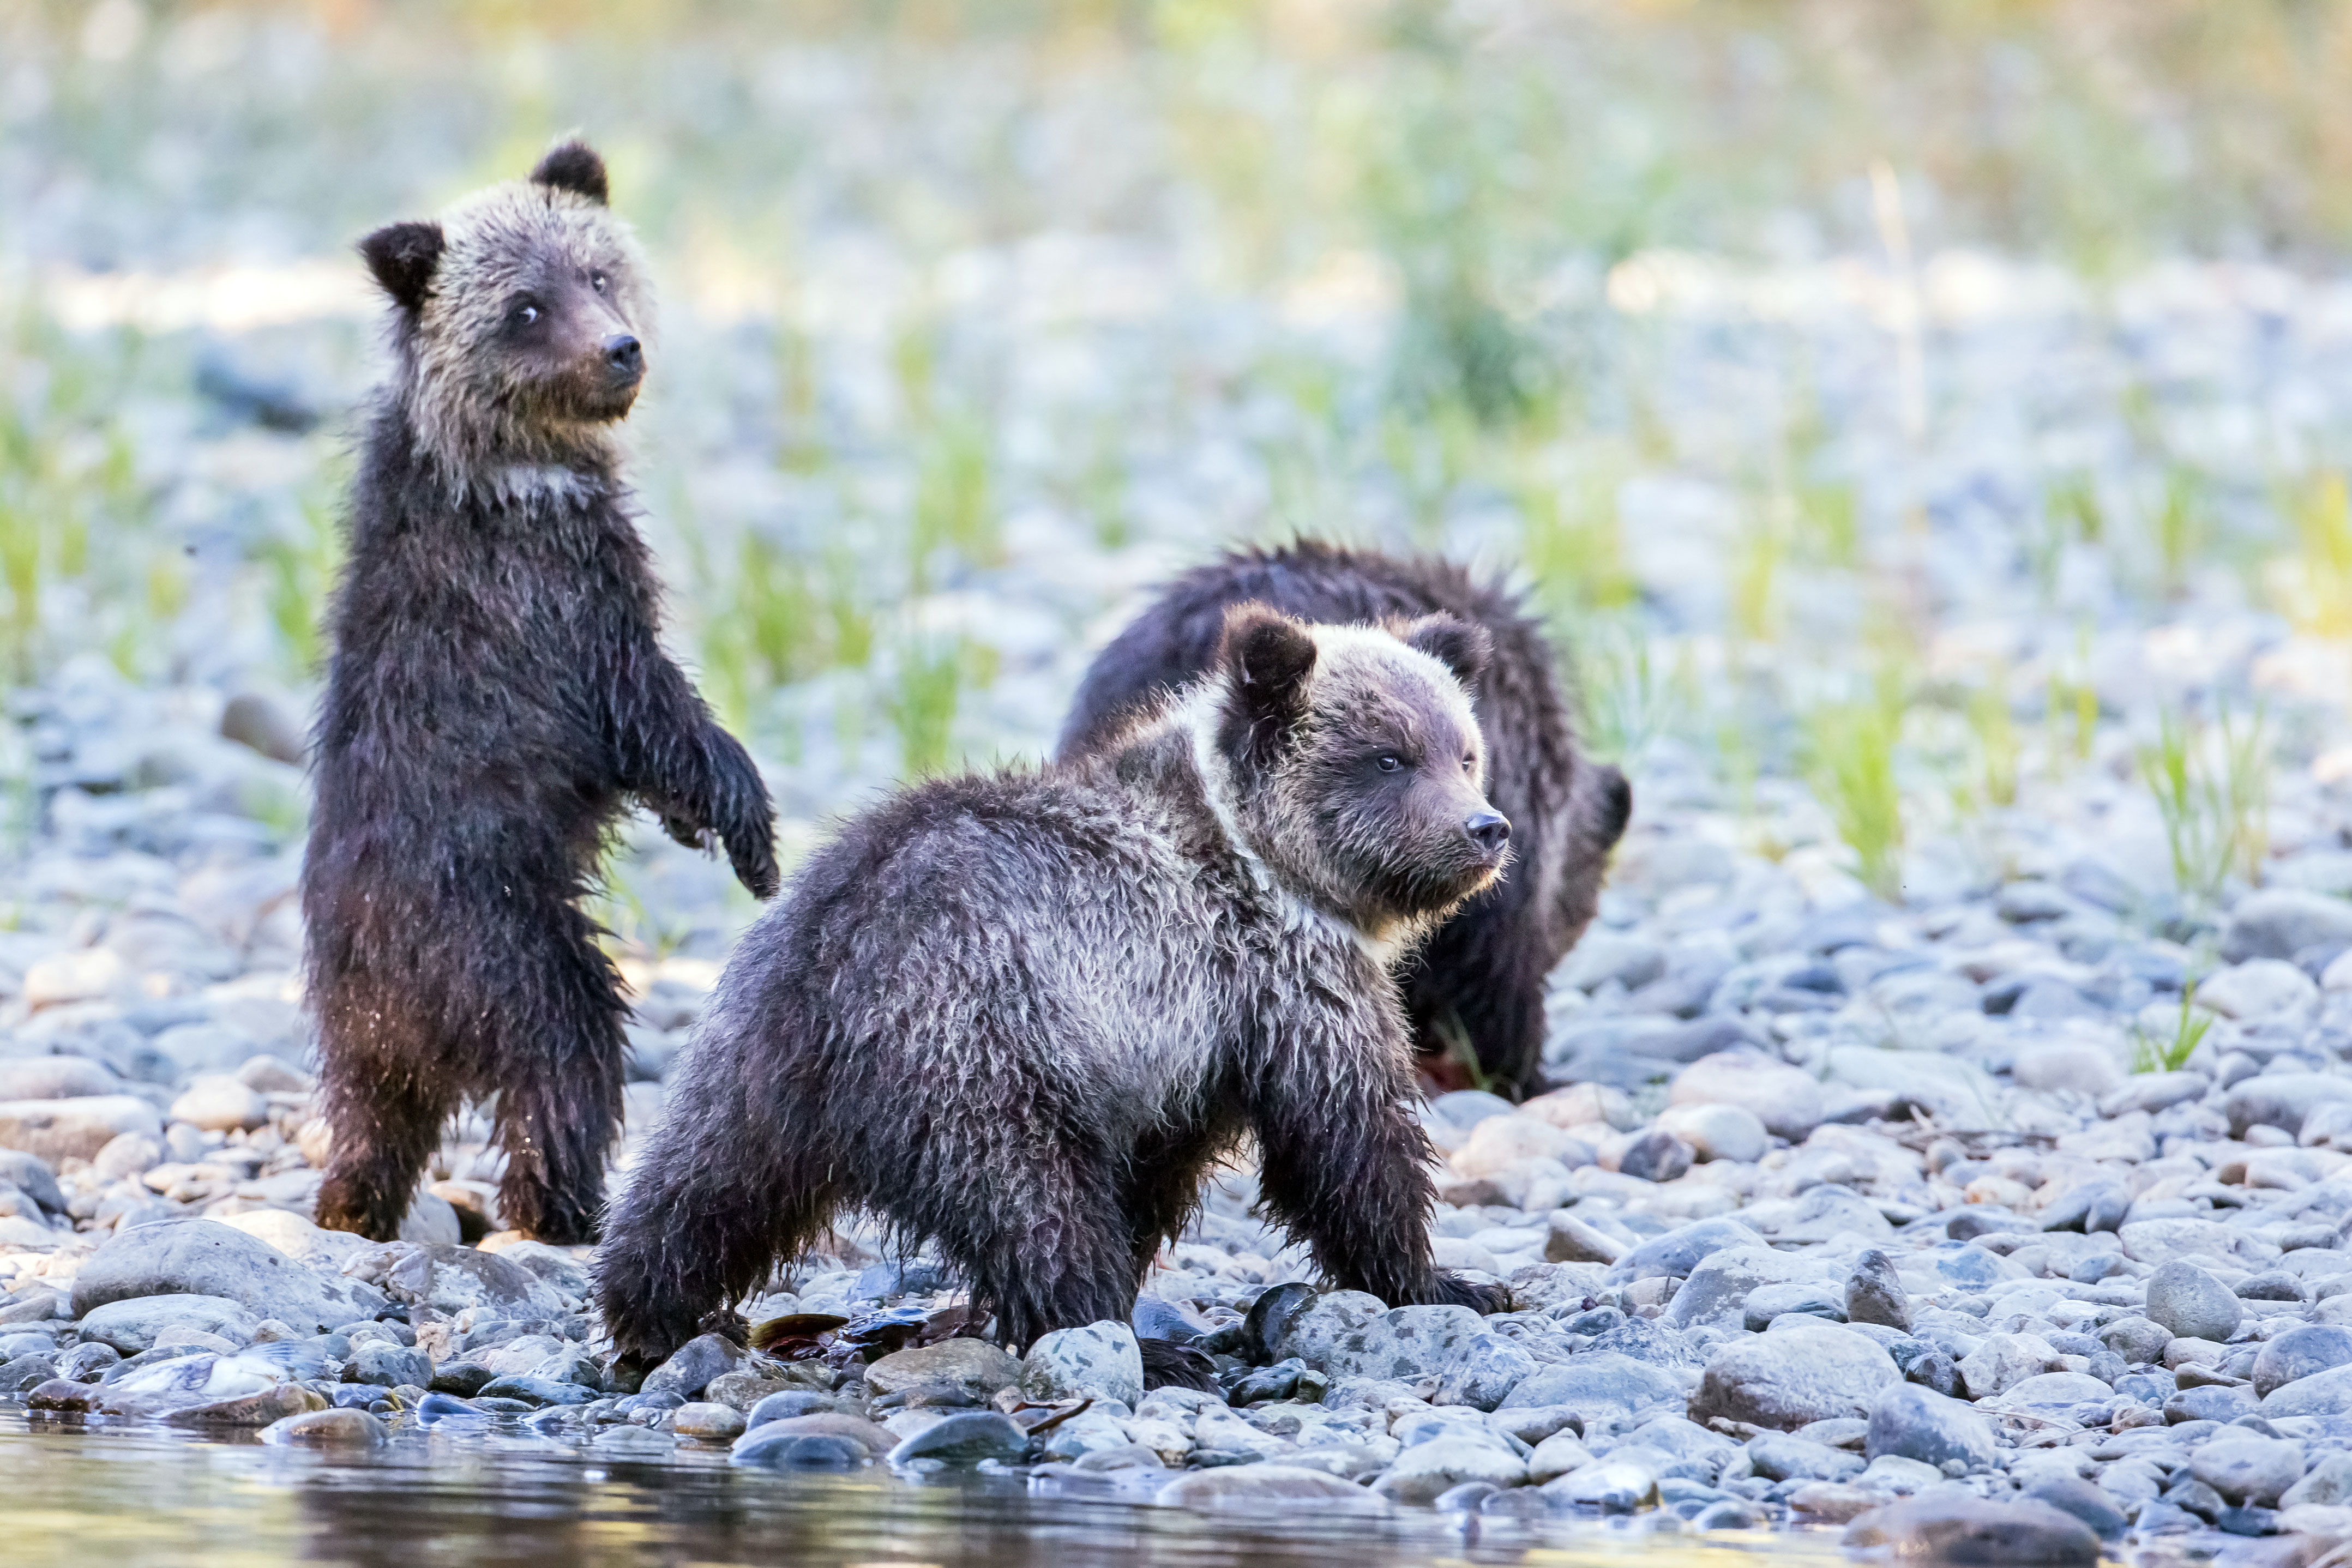 Grizzly cubs along the Atnarko River, Tweedsmuir South Provincial Park, British Columbia. Photo by Mick Thompson (license information here).
Deep in the pristine forests of Canada, far from the reach of human activity, endangered grizzlies and boreal caribou roam free, living off the vast riches of their seemingly endless habitats. But new data show that habitats for these and other threatened species of the Canadian wilderness are slowly being eroded away by industrial activity. Global Forest Watch Canada (GFWC) just released an updated map of Canada’s pristine forests showing a 5 percent (216,199 km2) decrease due to degradation and fragmentation between 2000 and 2013. These pristine areas, known as Intact Forest Landscapes (IFLs), are some of the last remaining forest at least 500 km2 in size and untouched by human activity. GFWC’s analysis also shows 92 percent of the reduction in Canadian IFLs occurred in areas that are home to one endangered species, while 14 percent of reduction occurred in habitats of at least six endangered species.
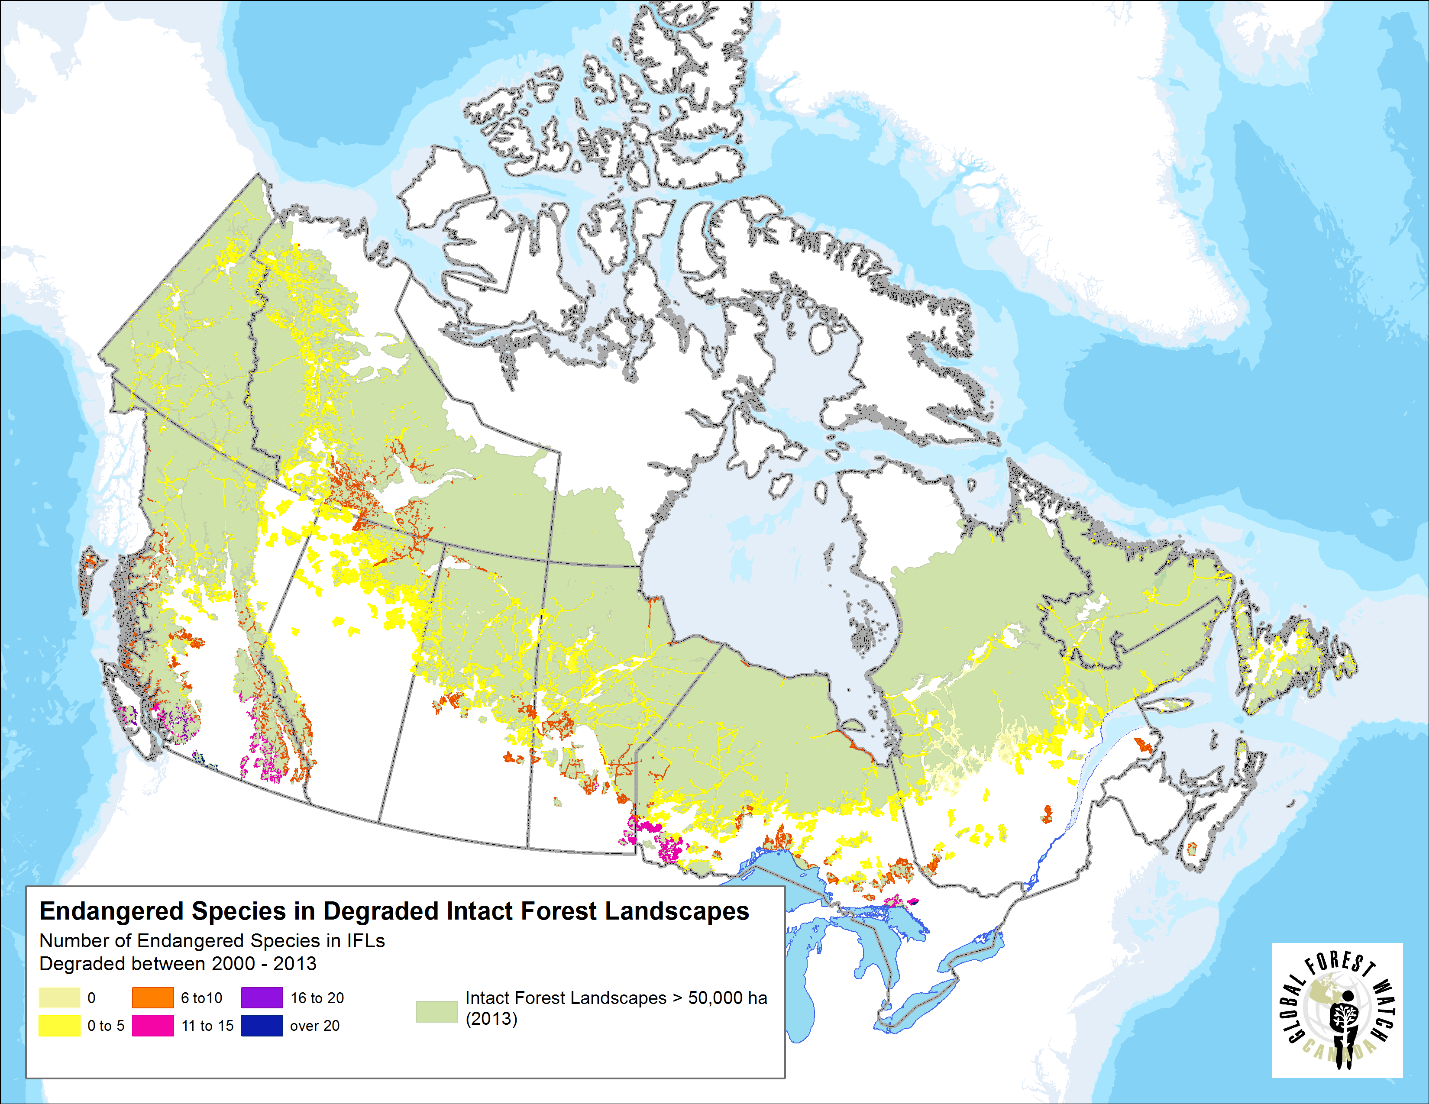 IFL degradation and species at risk.
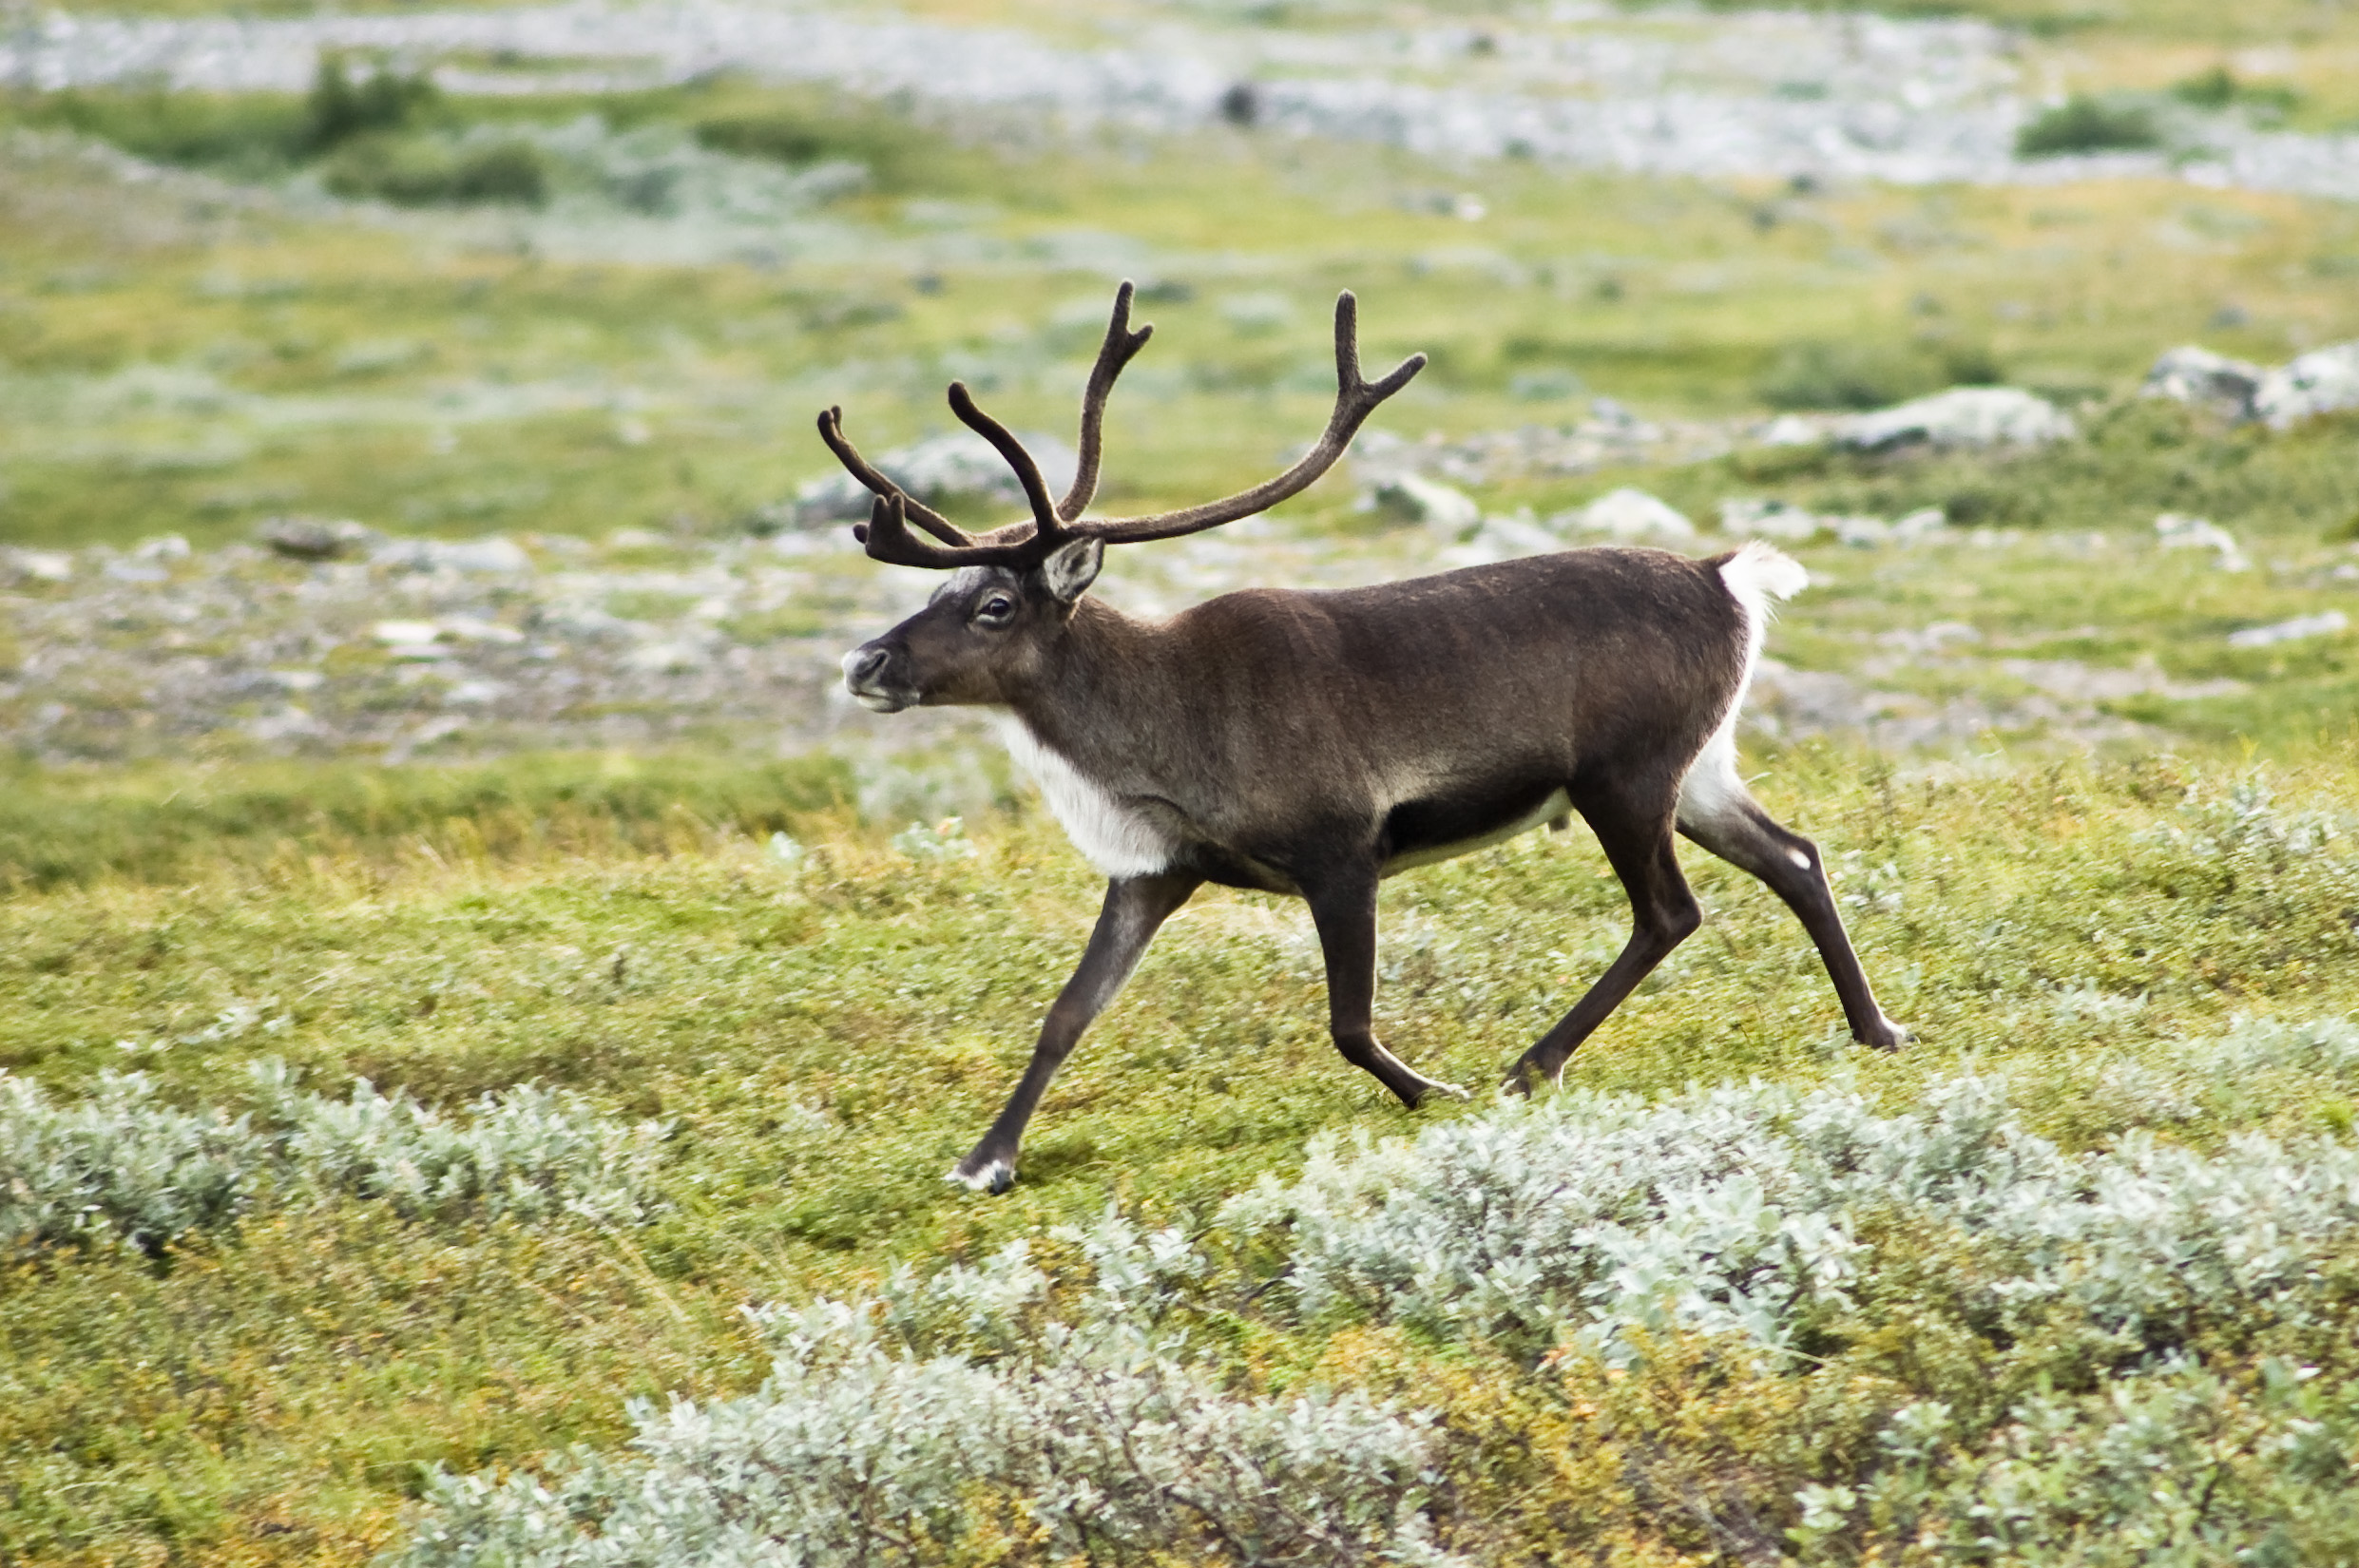 Strolling reindeer (Rangifer tarandus aka boreal woodland caribou). Photo by Alexandre Buisse (Nattfodd) – self-made (http://www.alexandrebuisse.org), CC BY-SA 3.0, https://commons.wikimedia.org/w/index.php?curid=2625968
Boreal woodland caribou and bird ranges most affected
Of the species affected by the reduction of IFLs in Canada, the threatened boreal woodland caribou suffered significant impact, losing over 6 percent of IFLs in its range between 2000 and 2013. Most of the loss or fragmentation occurred in Alberta and British Columbia, where 43 percent and 78 percent of IFLs within caribou ranges were lost. Quebec’s IFLs within boreal caribou ranges declined 7 percent during the same period.
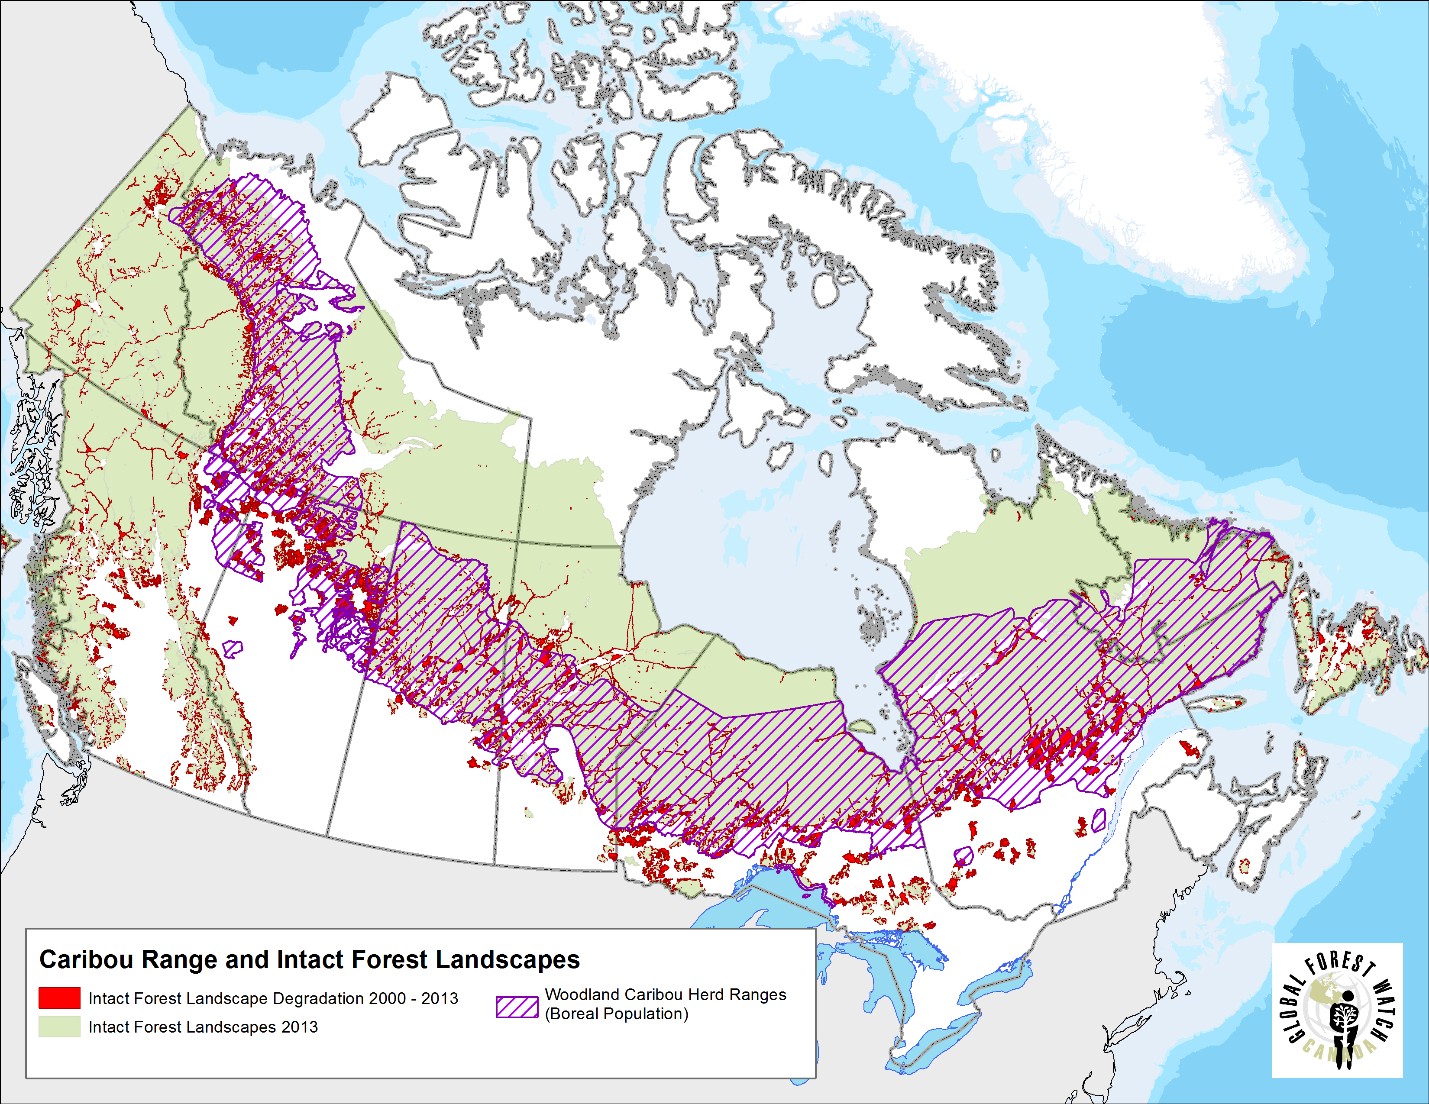 IFL degradation and boreal woodland caribou ranges.
Bird diversity was also affected as more than 6 percent of IFL areas with more than 100 bird species were degraded by industrial activity to the point where they were no longer considered intact by 2013. Research shows that forest degradation and fragmentation are just as threatening to biodiversity as deforestation. The rate of IFL fragmentation and reduction in Canada could spell disaster for many of the endangered species in the country if left unaddressed. GFW Canada’s updated IFL map can help track the status of these sensitive habitats to help conservation efforts ensure that the most vulnerable areas are protected against further damage.
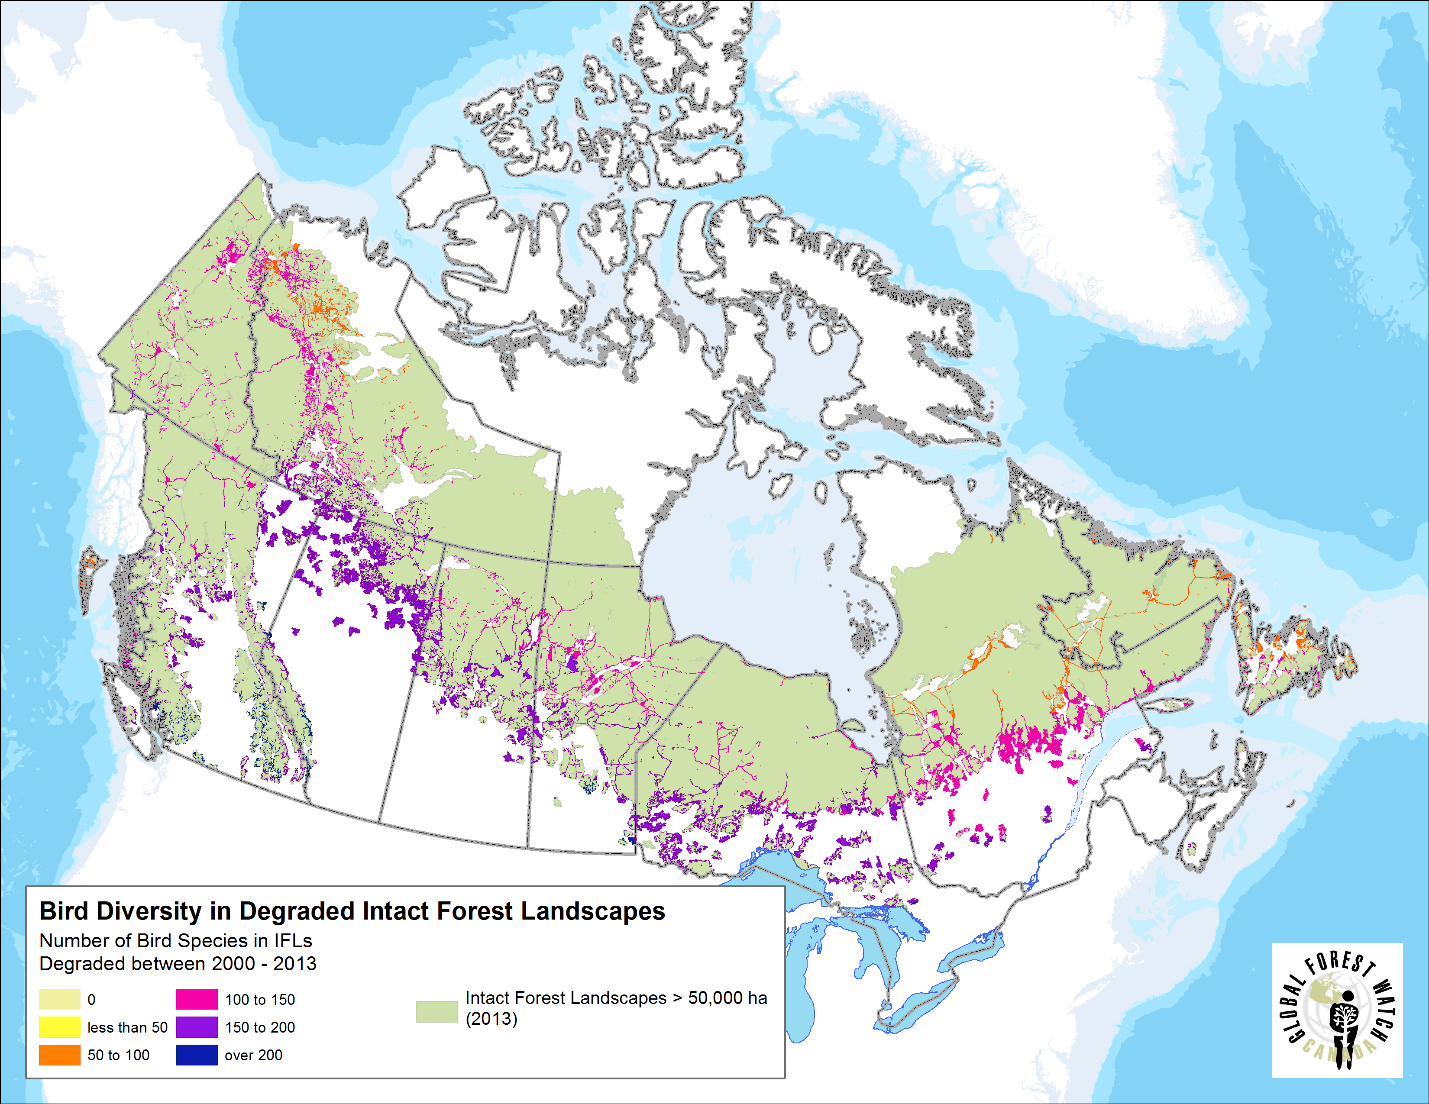 IFL degradation and bird diversity.
Logging primarily responsible for degrading Canada’s forests
Various development activities cause IFL degradation all around the world, but in Canada, logging is the single biggest driver. 60 percent of the degraded areas (129,487 km2) were inside of forest tenures allocated to companies for logging. Petroleum and natural gas development, including oil and gas facilities, pipelines, wells and seismic lines, was a distant but significant secondary driver, responsible for 6 percent (13,344 km2) of the reduction.
| Jurisdiction | Total IFL Degradation (km2) | Degradation in Forest Tenures | Degradation in PNG Tenures | Degradation in Mineral Leases | |||
|---|---|---|---|---|---|---|---|
| km2 | percent | km2 | percent | km2 | percent | ||
| Quebec | 49,636 | 36,178 | 72.9 | 1,475 | 3.0 | 59 | 0.1 |
| Alberta | 43,686 | 22,291 | 51.1 | 7,992 | 18.3 | 615 | 1.4 |
| Ontario | 37,061 | 31,939 | 86.2 | 0 | 0 | 141 | 0.4 |
| British Columbia | 23,037 | 21,174 | 92.5 | 1,042 | 4.5 | 30 | 0.1 |
| Northwest Territories | 19,504 | 0 | 0 | 1,388 | 7.1 | 28 | 0.1 |
| Saskatchewan | 16,186 | 8,242 | 51.0 | 169 | 1.0 | 37 | 0.2 |
| Manitoba | 16,167 | 8,595 | 53.2 | 0 | 0 | 247 | 1.5 |
| Yukon | 5,838 | 0 | 0 | 1,277 | 22.3 | 9 | 0.1 |
| Newfoundland & Labrador | 5,020 | 1,064 | 21.5 | 0 | 0 | 19 | 0.4 |
| Nova Scotia | 54 | 4 | 8.2 | 0 | 0 | 0 | 0 |
| Nunavut | 9 | 0 | 0 | 0 | 0 | 0 | 0 |
| Canada | 216,199 | 129,487 | 60.0 | 13,344 | 6.2 | 1,185 | 0.5 |
But that’s not to say that forest use is inherently bad. Forestry, for example, provides important resources like paper, wood fuel and construction materials that Canadians and people around the world depend on every day. Rather, the new map, available on Global Forest Watch, helps us better understand the cumulative impacts of these activities on our environment over time, providing a valuable tool for policy-makers and forest managers to plan more sustainable future land use practices. Identifying the drivers of degradation helps to focus those efforts on industries that need the most improvement and areas in most need of protection.
Mapping out a sustainable future
The updated look at the state of Canada’s Intact Forest Landscapes shows just how important monitoring is to protecting our forests and the biodiversity they house. The new map was created with the best available information, including Environment Canada disturbance data and satellite imagery, and uses methodology that is calibrated to account for characteristics that are unique to Canadian forest landscapes. The map can provide powerful insights when used with GFW Canada’s national datasets of industrial concessions and maps of industrial disturbances in forest. These data together help accurately assess the impact of major industries like logging, energy and transportation on Canada’s forests, and perhaps provide the first step toward creating more sustainable practices that prevent degradation in the future. Though 5 percent of Canada’s IFLs were degraded or fragmented between 2000 and 2013, there still remains 4.2 million km2 of pristine forests in need of protection. The opportunity is clear. If we act now, with powerful forest information in hand, we can combat the impacts of industrial activity on our valuable landscapes and the species that call them home.
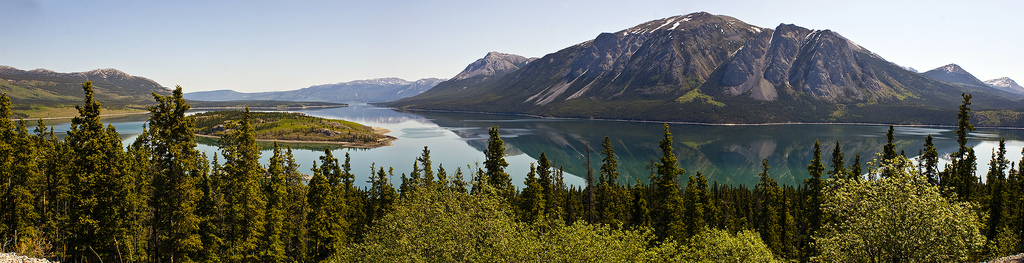
Wynet Smith is Executive Director of Global Forest Watch Canada, an independent non-profit organization, and Ryan Cheng is Director of GIS of GFW Canada. Find out more about Global Forest Watch Canada’s IFL data methodology here. BANNER PHOTO: Andrewsaurusrex (license information here).
Explore More Articles
Explore More Articles


