- Data
How accurate is accurate enough? Examining the GLAD global tree cover change data (Part 2)
Dec 17, 2015||5 minutes
Languages
Part 1 of this blog series available here.
In Part 1 of the GLAD tree cover data accuracy blog series, we explained two different accuracy assessments of the global tree cover loss and gain data produced by Dr. Matt Hansen and collaborators at the University f Maryland’s Global Land Analysis and Discovery group (GLAD), Google, the U.S. Geological Survey (USGS) and the National Aeronautics and Space Administration (NASA) . Today, we’ll dig into factors that increase errors and how this impacts the use of the data.
What causes errors in the data?
Errors are unavoidable in data that attempt to simplify the world—in the case of the GLAD global tree cover data into categories of tree cover loss, gain and no change. For most measures, the GLAD “loss” data has lower error rates than similar data sets—for example, recent data for Landsat-derived land cover and forest change in the 1990s had error rates of 21 percent and 17 percent, respectively. However, there are some areas in the GLAD data where error rates are 20 percent or even greater. Higher error rates can result from a number of factors, including:
- Low density tree cover canopy, such as that found in the subtropical biome, which makes it harder to detect loss because the change from tree cover to bare ground is less noticeable than in a dense forest.
- Small-scale clearings, like those prevalent in Sub-Sahara Africa, which are more likely to get missed or underestimated by the data set because they have more edges compared to their area. Pixels on the edges of clearings are often blurred in satellite images, so the data misses a lot of “loss” in these small patches.
- Gradual changes, like tree cover gain, which are more difficult to detect than sudden changes.
It is also important to remember the scale evaluated in these studies—both evaluated the accuracy of the data for large regions or continents, but not for local areas. This means that while we can feel confident that the data is broadly accurate at global or regional scales, we can’t say anything about the accuracy of any specific location.
How accurate is accurate enough? It depends
We know that the GLAD data is not perfect, and that error rates vary even between regions and biomes, but that still doesn’t tell us if the data is accurate enough to give us insight into how the world’s forests are changing. The answer: It depends on where you’re looking and how you want to use the data. When deciding if it is appropriate to use the data for your needs, the first step is to understand the accuracy of the data—congrats, you have already started by reading this series! The next step is to determine how the precision and possible errors may impact your specific application. The question of whether the data is accurate enough will be different for each use case, but here are some general guidelines:
- Investigate trends and patterns at large scales: The global error rates are relatively low compared to similar data sets, so we can feel confident using the data to examine trends and patterns at large scales (e.g., global, regional, national).
- Use 3-year averages: Given year-to-year uncertainties, we recommend using 3-year averages. Clouds literally get in the way of what satellites can “see,” especially in the humid tropics where clouds can obscure the view below for much of the year. That means that occasionally trees may be felled or burned under the cover of clouds and it may not be detected until the following year. Users of the data can smooth out such uncertainty by examining the average over multiple years.
- Assess general locations of loss: While the accuracy was not assessed at local scales, we know that most missed “loss” occurs on edges and so we can confidently use the data to identify the general location of loss locally.
- Use caution with local measurements: However, making precise measurements locally (e.g. hectares of tree cover loss, carbon emitted from deforestation) requires further information on accuracy in that particular location—for example, through knowledge of the local context, satellite imagery, comparing to other forest change data, etc.
- Match your confidence to the accuracy: Avoid making strong claims based on data with low accuracy (i.e. areas with low canopy density, tree cover gain, etc.).
If you have questions about your use case, you can reach out to our community through the GFW Discussion Forum where other users discuss the strengths and limitations of the data.
The GLAD data in context
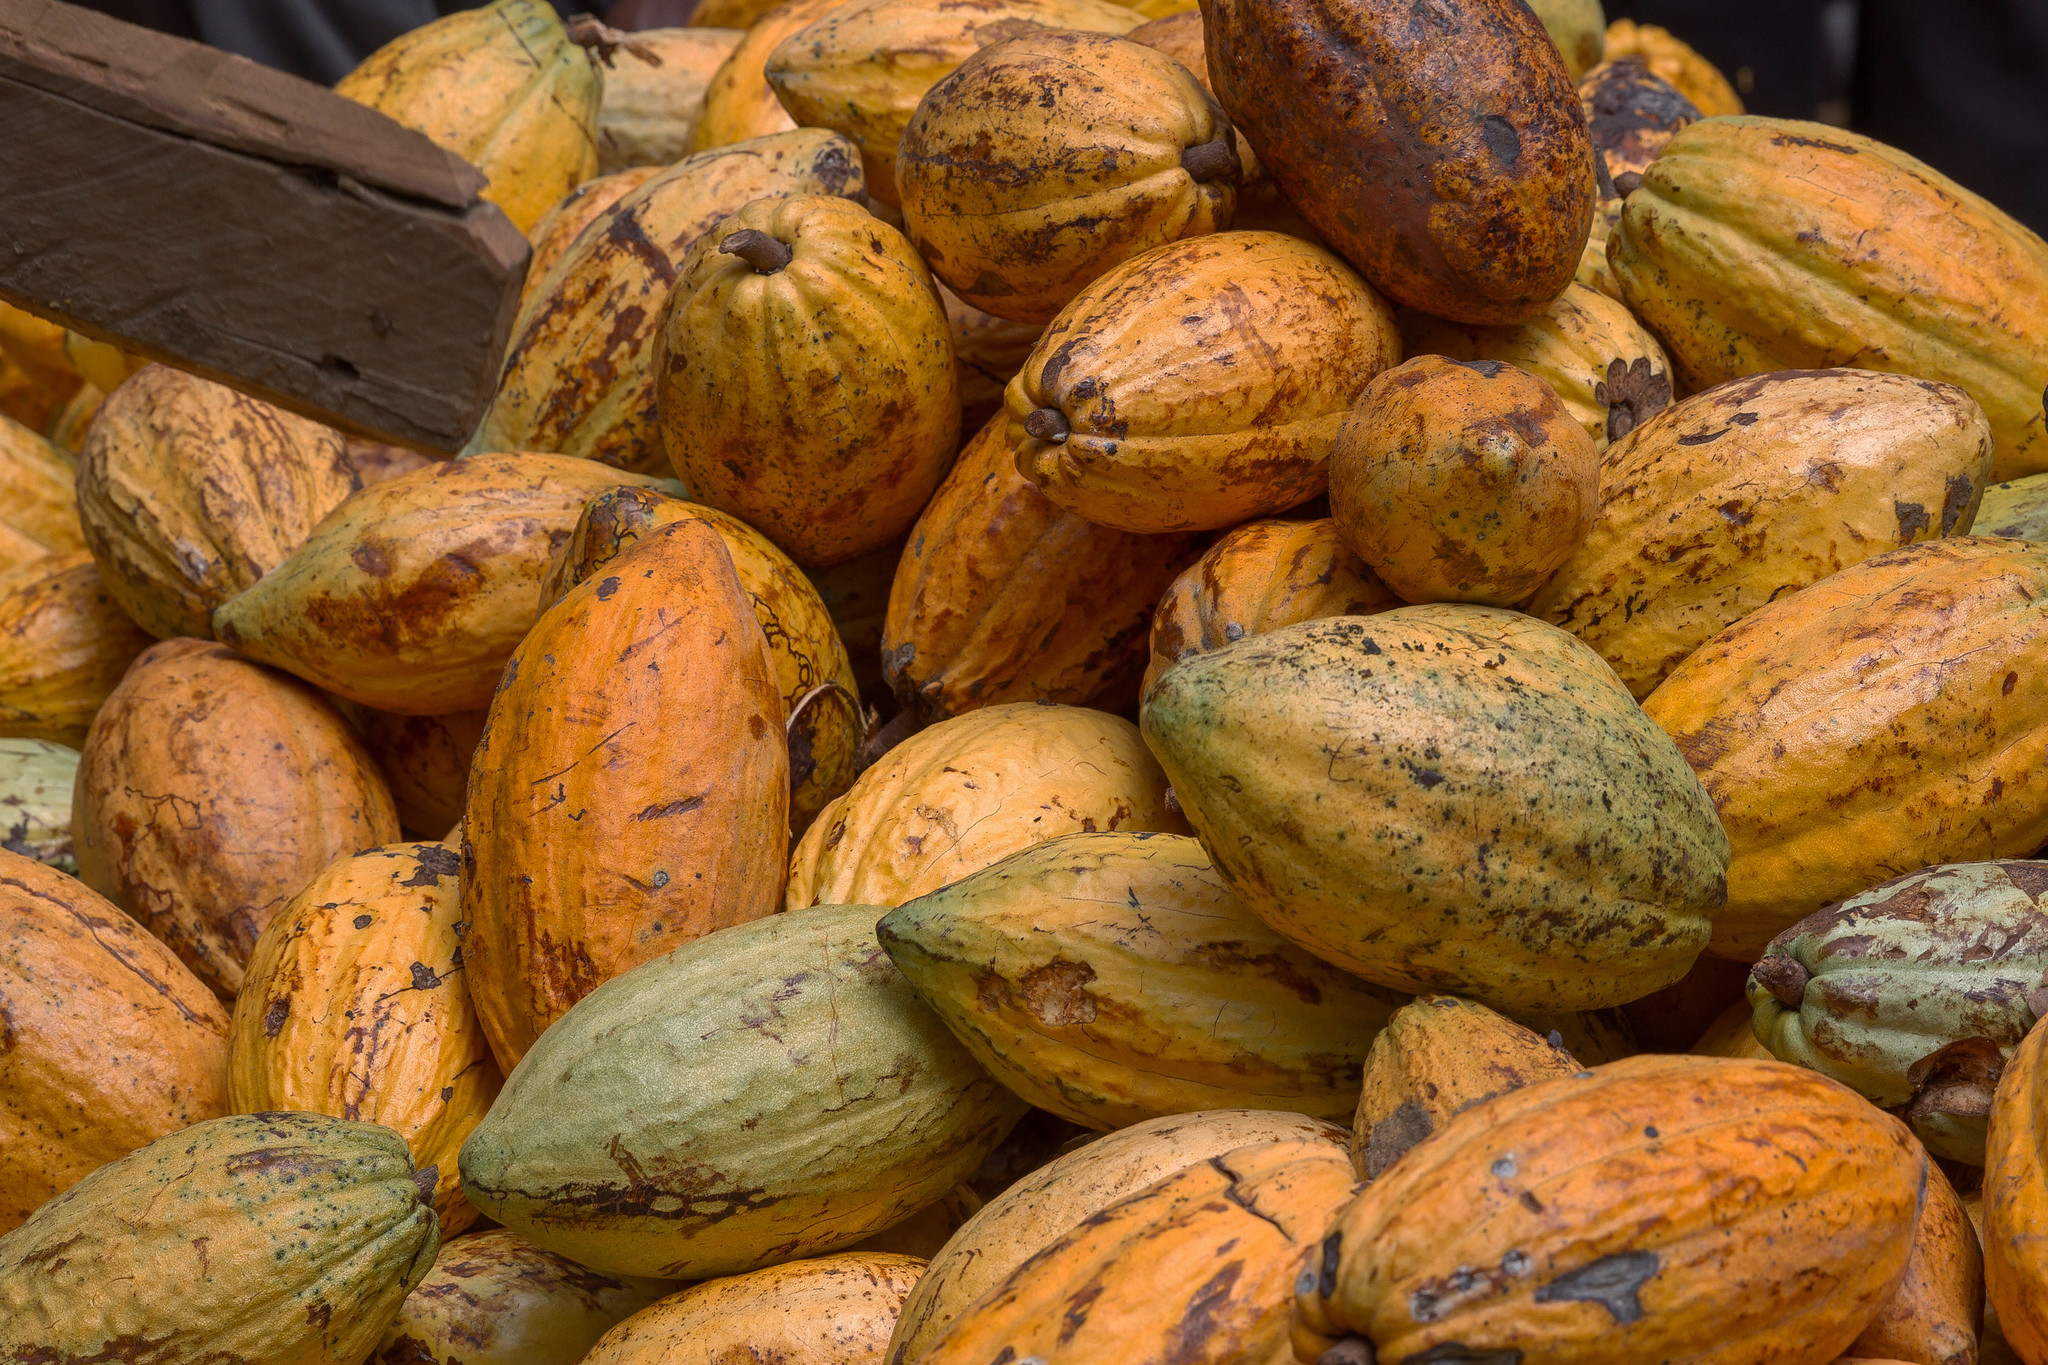
Though not without error, the GLAD data remains the best global tree cover loss data set, with a consistent methodology world-wide that allows tracking of global trends as well as a high enough resolution to monitor and discover local areas of tree cover loss, such as in the tar sands of Canada or for cocoa production in Peru. The data represents a major improvement over previous global data of forest change: many are based on low spatial resolution data (250- or 500-meter), while others (such as the Forest Resources Assessment of the FAO) are not spatially explicit or updated as frequently. Local data often boasts lower error rates, since it is calibrated in that particular context, but is costly to produce and rarely available on a yearly basis. GLAD tree cover change data is not a perfect representation of tree cover loss or gain, and there are some aspects of the data with high error rates. Nevertheless, it is the best available data of tree cover change at a global scale and is freely accessible on Global Forest Watch. We hope that by explaining the accuracy of the data and encouraging consideration of the error rates before application, we can empower our users to draw appropriate conclusions that can challenge “business-as-usual” deforestation across the world.
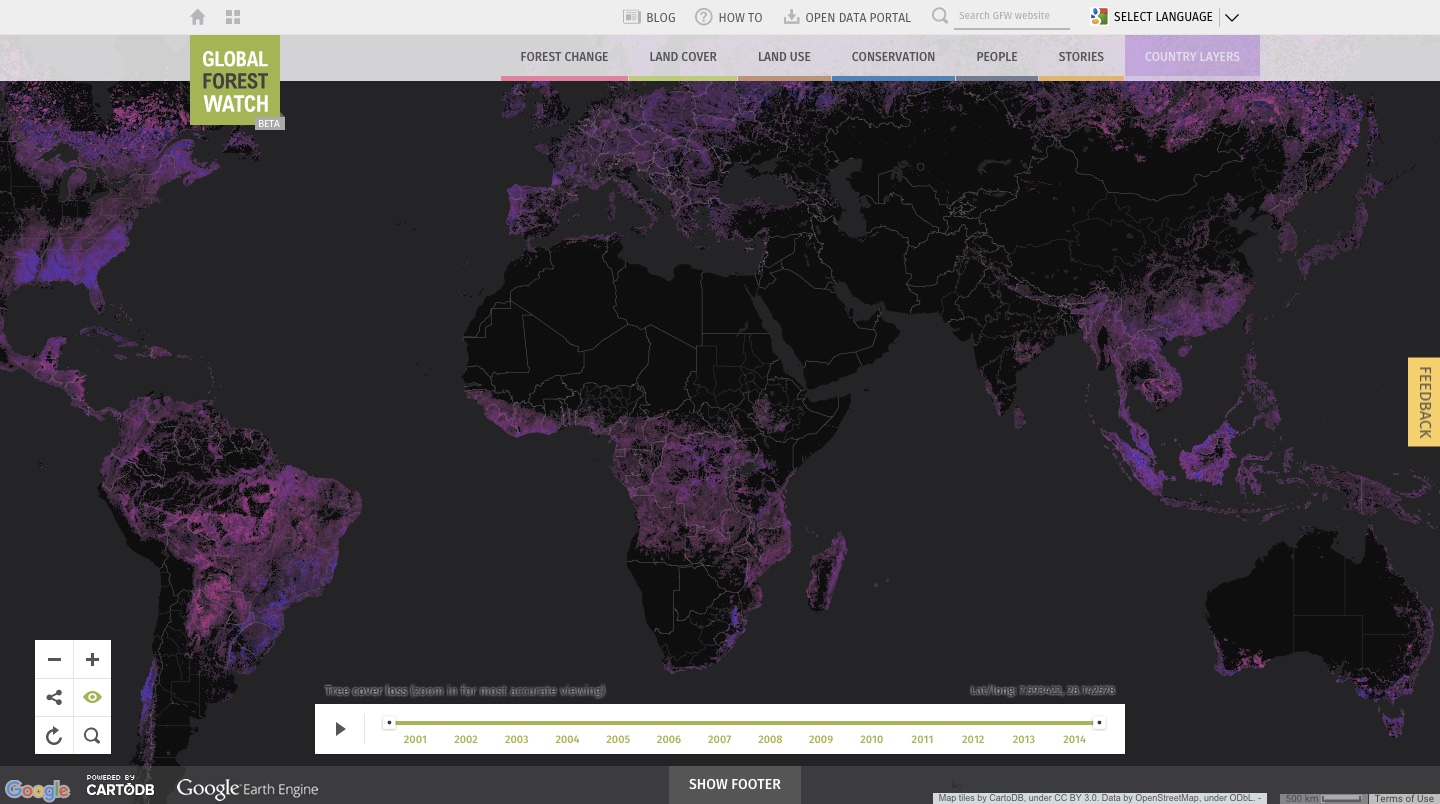
BANNER PHOTO: GLAD tree cover loss data visualized on Global Forest Watch.
Explore More Articles
Explore More Articles


