- Data
Technical Blog: A Fresh Look at Forests, 2011-2013
Apr 02, 2015||5 minutes
By Peter Potapov, Matt Hansen, James Anderson and Rachael Petersen
Note: This blog provides details on reprocessed tree cover loss data released by the University of Maryland, Google, the USGS, and NASA. The text below provides details specifically on the 2011-2013 reprocessed data, but also applies to newly released reprocessed data from 2012-2014. In this most recent update, some additional loss was detected thanks to the addition of new satellite images in the archive.
The release of new global tree cover loss data for the year 2013 from the University of Maryland and Google on Global Forest Watch represents another step forward on the journey to better understand how forests are changing around the world. But the updates are not only forward-looking; in this case they include revised and improved data for the years 2011 and 2012. Below, we explain the revisions—how the data changed, why, and the implications for the world’s forests and how we monitor them. More technical details are available here.
WHICH DATA HAVE CHANGED?
We updated the 2011 and 2012 tree cover loss data on Global Forest Watch. This data uses the Landsat satellite system, combined with advanced algorithms and cloud computing, to map annual tree cover loss at 30-by-30-meter resolution.
The 2011-2012 data have also been updated on the Earth Engine Partners site, where the original data is also available for download. Note that tree cover gain has not been updated, nor has tree cover loss from 2001-2010.
HOW DID THE DATA CHANGE?
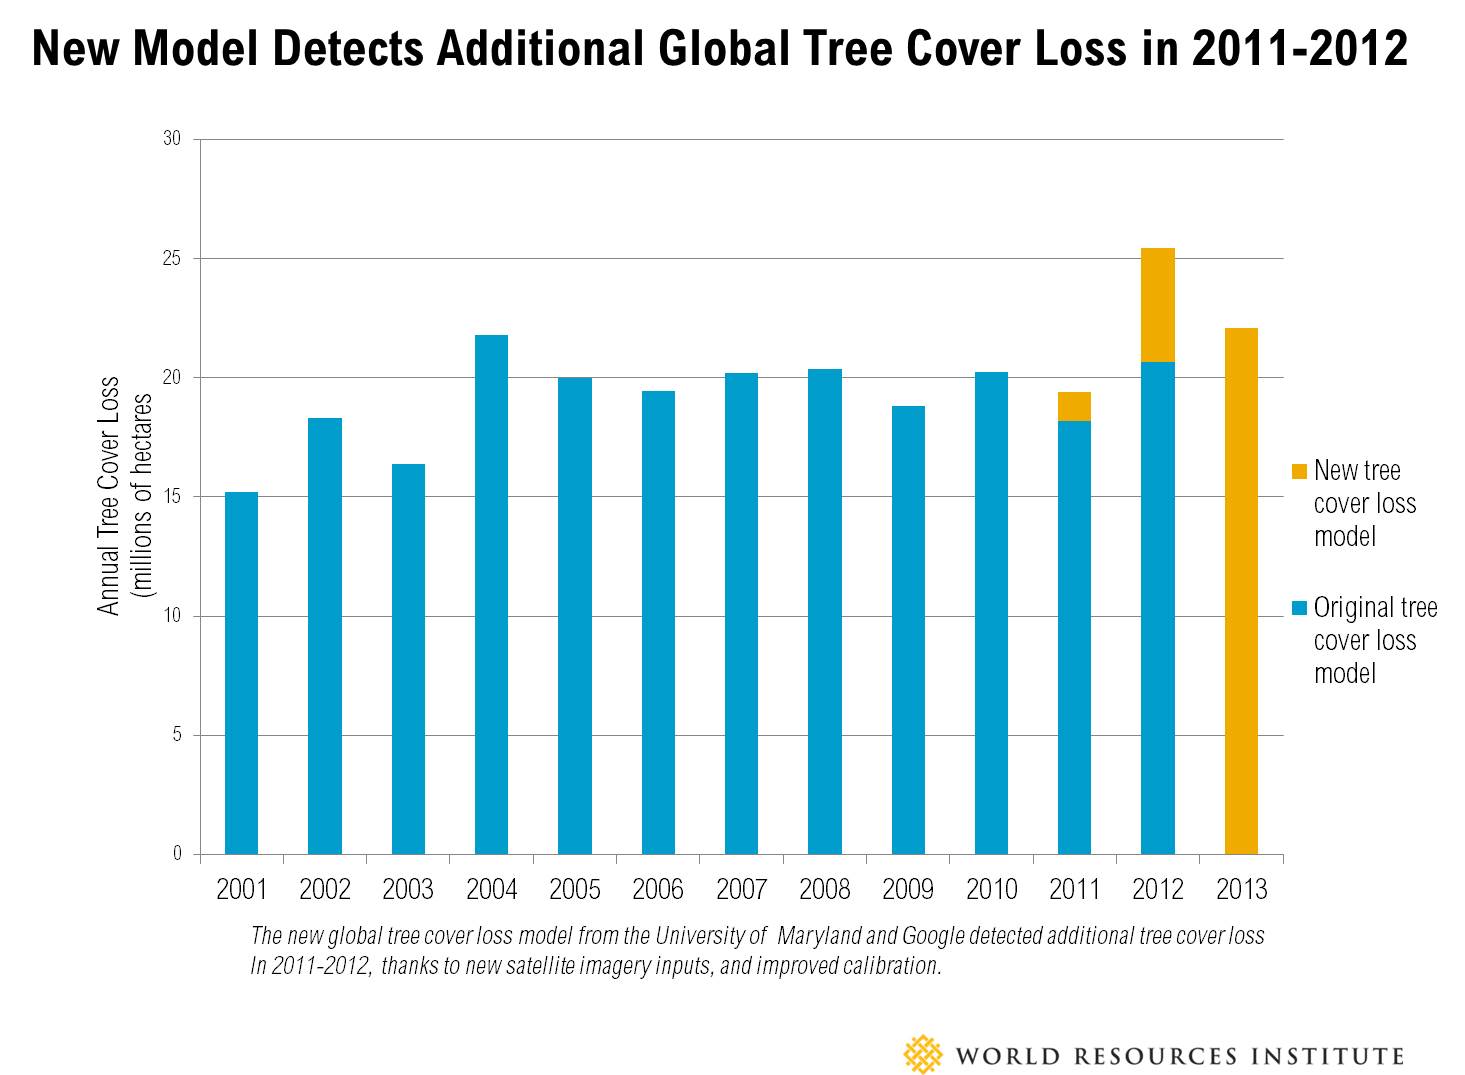
The new analysis detected 6 percent more tree cover loss for 2011 than the original data set, while loss for 2012 increased by 22 percent. Because the new algorithms are more sensitive to change, all of the revisions to the data resulted in increased detection of tree cover loss. In other words, all of the tree cover loss from the original data set is included, plus additional tree cover loss that was better detected in the new version. The areas that saw the greatest change include:
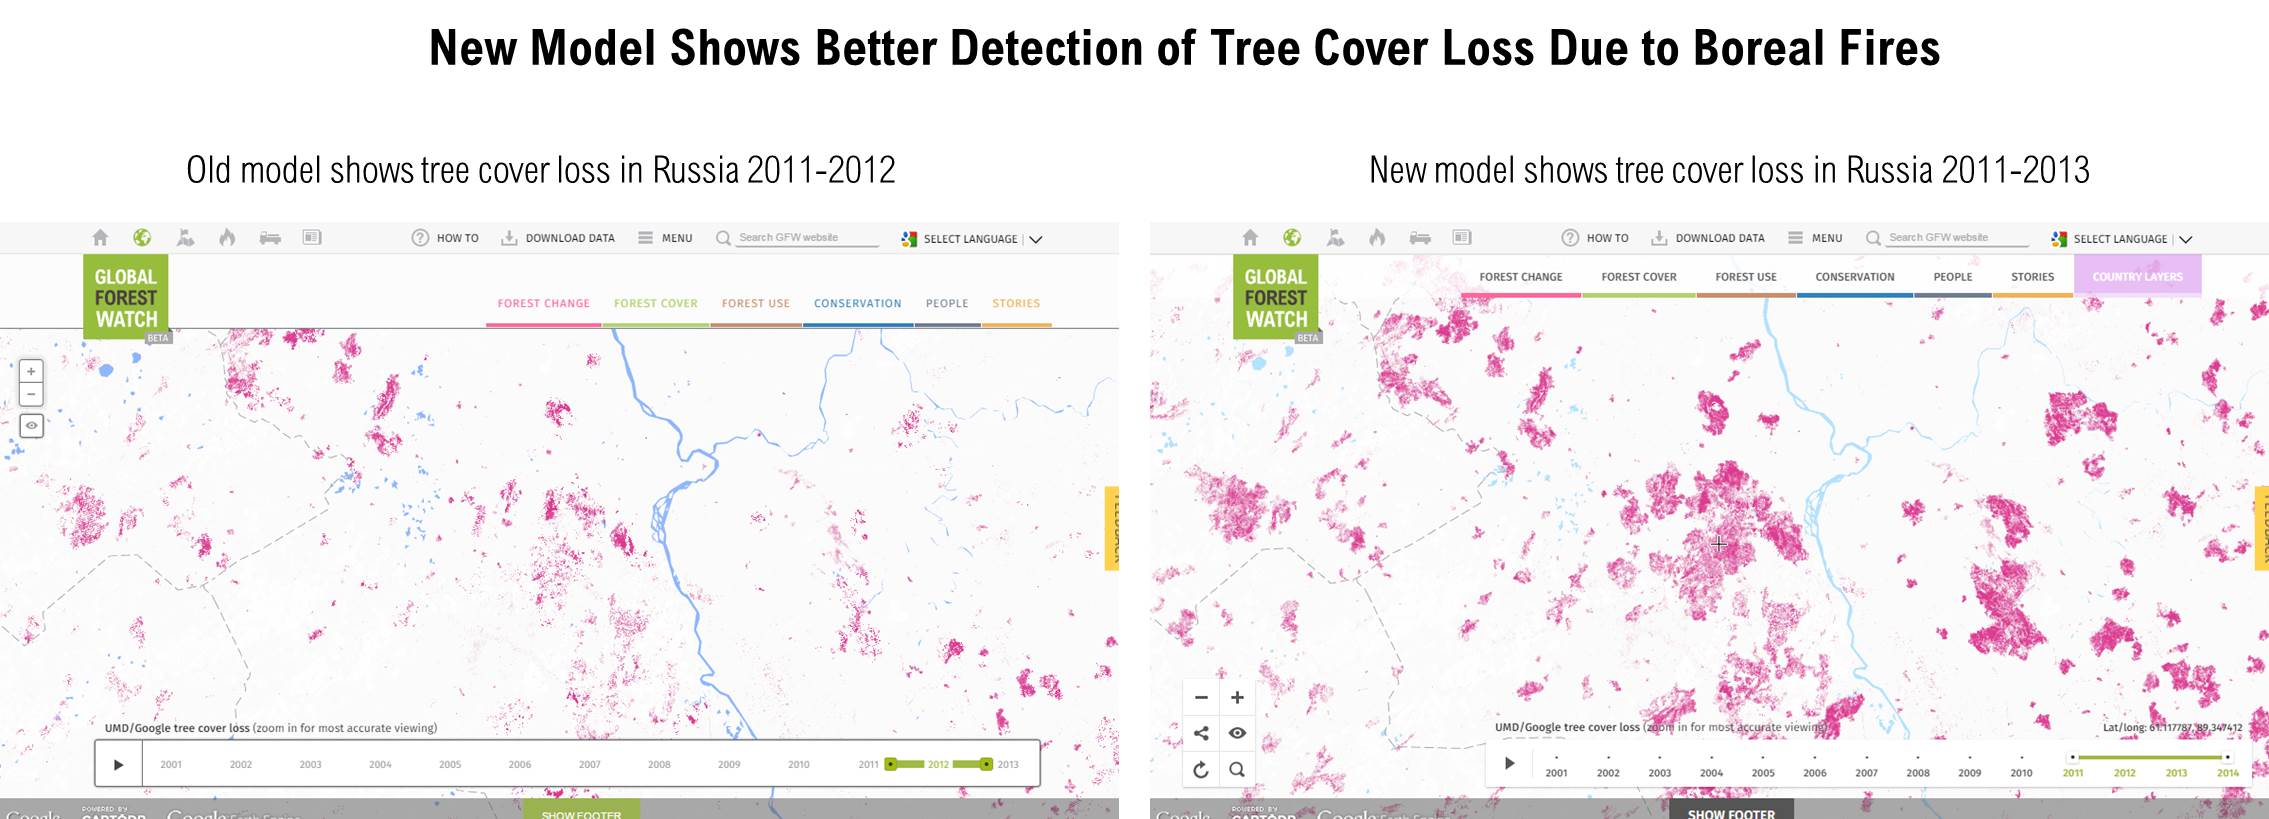
- Russia and Canada (tree cover loss was higher than previously estimated due to improved detection of loss caused by boreal forest fires).
- In Brazil, the new model better detected rotation in forest plantation and clearing of Cerrado, increasing total forest loss detected in 2012.
- In Uruguay and some other countries, high loss from 2011-2013 is due to rotation of Eucalyptus plantations established after year 2000. The detection of this activity has improved since the release of the 2000-2012 data, which is why we see increase in forest cover change only after year 2011.
- Smallholder rotation agricultural clearing in dry and humid tropical forests was better detected. Specifically, in Southeast Asia countries (Laos, Thailand, Vietnam, Myanmar) and in West Africa (Guinea, Liberia, Sierra Leone).
- Selective logging, for example within the industrial forests in Southern United States, was measured more accurately.
- Clearing of short cycle plantations in sub-tropical and tropical regions also saw changes due to improved detection.
Note that the default display for tree cover canopy threshold on GFW is 30 percent.
WHY DID THE DATA CHANGE?
To put it simply, the numbers have changed because we now have access to more and better data, which has allowed us to improve the algorithms that detect tree cover change. The new algorithm uses data from all available Landsat sensors, unlike the original model, which was built using only Landsat 7 data. The data 2010 and 2011 in the new model include images captured by the Landsat 5 satellite, which was decommissioned in year 2012. The year 2012 is a particularly data-limited period as only Landsat 7 data were available. However, the reprocessing incorporates thousands of previously inaccessible images from the Landsat archive for 2011 and 2012. The historic images helped fill in gaps caused by cloud cover, smoke, and limited satellite coverage. The year 2013 also includes images from Landsat 8, a new generation of the satellite launched by NASA in 2013. The sharp new Landsat 8 images, combined with Landsat 7, helped re-calibrate the mapping algorithms to be more sensitive to change. By running the newly-calibrated algorithms over historic data, we were able to pick up new change. More technical details, particularly on Landsat 8, are available here.
WHAT ARE YOUR PLANS FOR UPDATING OTHER YEARS?
We plan to continue to revise data even further back into the archive, eventually reprocessing data back to at least the year 2000. Stay tuned for updates.
WILL THIS AFFECT HOW I USE THE DATA?
How you use the reprocessed data will depend on your objectives and the depth of your technical engagement with the data. For many non-technical users, the data update may simply mean that it will be easier to see fine-scale changes on the GFW map. Technical users, however, should be aware that the reprocessing of 2011 and 2012 involves different data and techniques than those from the original 2001-2010 data, and therefore users should be cautious when comparing across those time periods. And as usual, it is important to use the data with a strong understanding of data limitations and definitions. We recommended using the most recent data (in this case, the 2011-2013 update) for any analysis. We recognize that the original data is already widely distributed and is currently being used around the world for scientific studies and forest management decisions. For such users, this data update may require users to adjust their data inputs, revise their findings, or tweak their management regimes. The science in this space is rapidly evolving, and we will seek to share updated and improved information whenever possible so that users can work from the most recent and best information. This process of continuous refinement is central to Global Forest Watch’s approach: as the science evolves, we evolve with it. Please use the GFW Discussion Forum to share any questions, or email us at gfw@wri.org. Visualize the new data on Global Forest Watch here, or download and analyze the data on GFW’s new Open Data Portal here. Learn more about the researchers at Google Earth Engine Partner page. *Note, all tree cover loss numbers calculated with a 30% threshold for tree cover canopy density.
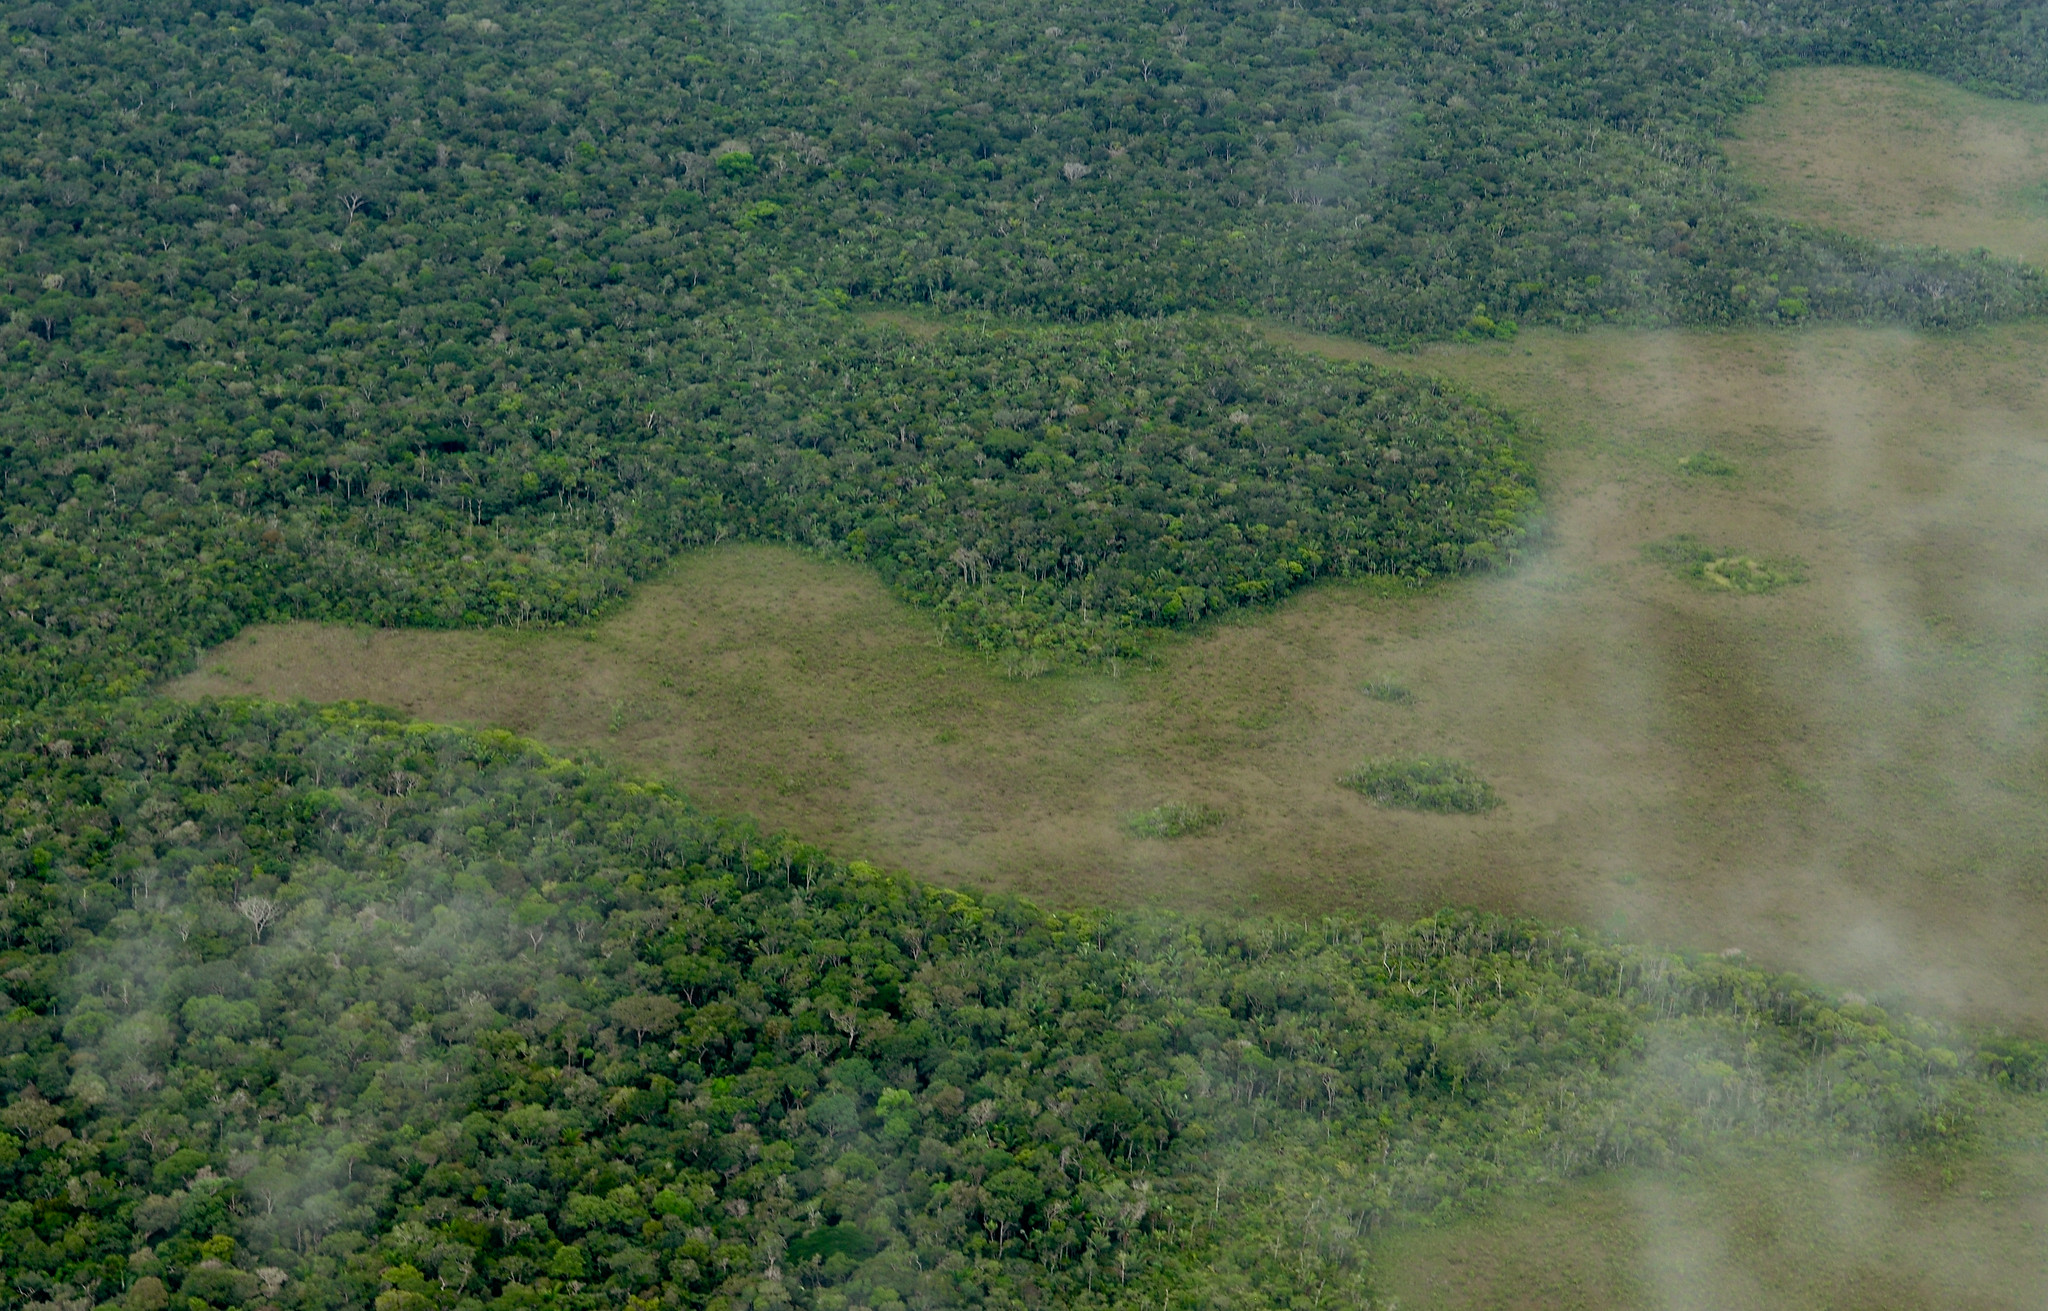
BANNER PHOTO: Banner photo by NASA Earth Observatory (Flickr).
Explore More Articles
Explore More Articles


