- Data
Detecting “Hot Spots” Along Frontiers of Forest Loss
Plagued by for many years by wildlife poachers and deforestation, the northern tip of Chiquibul, Belize’s largest national park, became a hot spot of forest loss in 2019. In an age of climate destabilization and the largest mass extinction in 66 million years, primary forests like Chiquibul are strongholds of carbon storage and species habitat and therefore crucial to protect. But with millions of hectares of primary forest loss occurring around the world, knowing more specifically where we should be sounding the alarm can be a challenge.
Forest loss “hot spots” can help with that. Global Forest Watch’s new hot spot analysis combines the timing and location of primary forest loss from the last 18 years to pinpoint areas where the intensity of loss is either improving, deteriorating or remaining consistent across time. Available for countries with humid tropical forests, these hot spots build on previously published analysis to home in on the most critical trends in forest loss.
New hot spots: Road construction in Cross River National Park, Nigeria
New hot spots identify areas of primary forest loss that were only identified in the most recent year of data. These appear in most countries, often in previously relatively undisturbed areas. One such hot spot appeared in Nigeria in 2018, intersecting with Cross River National Park and the country’s only Intact Forest Landscape. The park is home to rare and endangered species like forest elephants, pangolins and 18 primate species (including the critically endangered Cross River gorilla).
New hot spots like this often represent the frontiers of primary forest loss, where human development is expanding. In Nigeria, a six-lane, 260-kilometer highway proposed in 2015 was initially slated to run directly through Cross River National Park. Although the route has been shifted from the heart of Cross River National Park to just outside its borders, initial clearing for this highway has already torn down forests as well as small rubber and cocoa plantations and farms that local communities rely on for their livelihoods. The most recent update of the data confirms that the new hot spot continued to expand into the heart of the Intact Forest Landscape and National Park in 2019. As construction of the highway and a recently approved port progresses, data updates and monitoring will confirm whether new hot spots continue to spread as the forest becomes more accessible and susceptible to additional losses.
 New hot spots overlap with Nigeria’s only intact forest landscape and continue to expand into the biodiversity rich Cross River National Park in 2019.
 Intensifying hot spots: Complicated land claims in Intanki National Park, India
Intensifying hot spots show where primary forest loss is becoming more concentrated over time. In India, intensifying hot spots in the northeastern part of the country align with nearly two decades of primary forest loss, expansion of infrastructure projects, as well as logging, shifting cultivation and fuelwood collection.
Intensifying hot spots completely cover Intanki National Park, which lost 7% of its primary forest from 2002-2019. Reports indicate loss in this park is potentially linked to clearing for fuelwood and farmland by local tribes who have purchased or occupied land in the national park which they feel is part of their traditional heritage. Additionally, decreasing arable land and pressure from two national separatist insurgent groups living on the outskirts of the park as part of a ceasefire agreement have also contributed to intensifying loss.
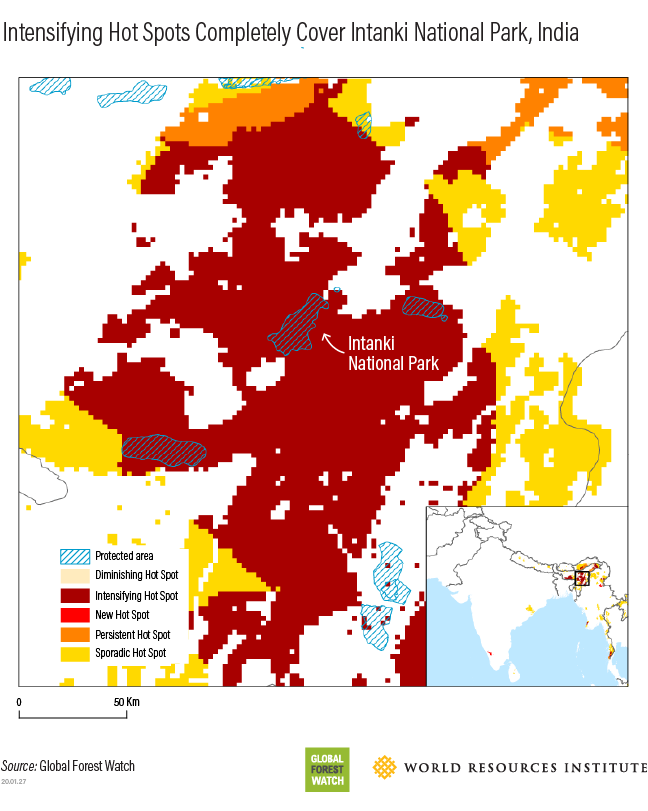 Intensifying hot spots have overtaken Intanki National Park, highlighting the vulnerability of valuable forested land.
Diminishing hot spots: Successful protection measures near Cordillera Azul National Park, Peru
Hot spots can also highlight where the rate of primary forest loss is diminishing through time. Most of these spots are found in South America and could indicate either a positive intervention that is slowing primary forest loss, or where loss is diminishing because there is little forest left to clear.
Peru’s only diminishing hot spot may be an indicator of success. The spot can be found just outside Cordillera Azul National Park, a biodiverse area that stretches over both the Amazon Basin and the Andes mountains. Cordillera Azul has been a REDD+ project site since 2013. The project aims to protect the area and benefit surrounding communities through environmental education, land-tenure assistance and socio-economic benefits. A diminishing hot spot is a positive sign that the project could be working and compared to the 2018 data, this diminishing hot spot area has expanded significantly. However, intensifying and new hot spots in other parts of the park may indicate that some of this loss has shifted to other landscapes.
 Peru’s only diminishing hot spot can be seen outside and within the Cordillera Azul National Park in a REDD+ project area.
Persistent and sporadic hot spots: Patterns to keep an eye on
Persistent hot spots show areas where loss has been steady through time and isn’t necessarily getting better or worse. Persistent hot spots are frequently associated with long-term (17 or 18 years of loss) clearing for agriculture, which can be seen in Panama, Honduras and Southern Mexico.
Persistent hot spots (orange) overlap with agriculture and pasture in Oaxaca, Mexico.
The last hot spot category, sporadic hot spots, is the most common. This represents a shorter-term, “on again, off again” pattern. In Central Africa these sporadic spots are most often associated with shifting cultivation, a type of rotational agricultural practice where forests are cleared for crops, then left fallow for several years to regain nutrients in the soil before being cleared and planted again. This cyclical pattern can be seen in the Republic of Congo and Democratic Republic of the Congo, where sporadic hot spots overlap with areas of shifting cultivation.
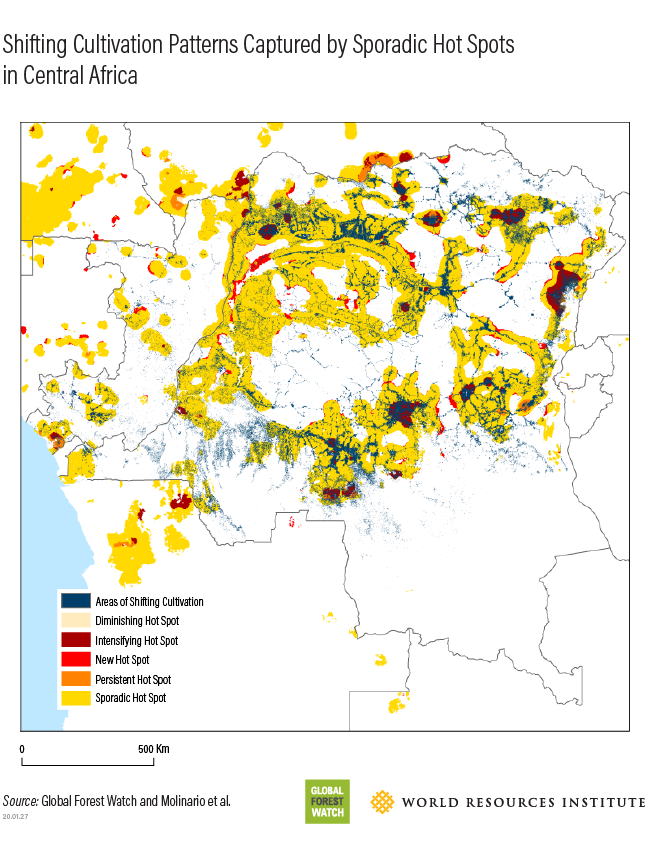 Sporadic hot spots (yellow) capture the cyclical loss patterns of shifting cultivation in Central Africa. Areas of shifting cultivation are designated by the “rural complex” (blue, Molinario et al. 2015) and denote a mosaic of land cover, including settlements, transportation routes, active and fallow vegetation and primary and secondary forest.
 Identifying important trends within primary forest loss data grants us a more nuanced picture of what would otherwise be billions of pixels of data. New hot spots can help us draw attention to areas of recent disturbance, intensifying hot spots show us where long term loss is worsening and diminishing hot spots indicate where efforts may be proving effective. Continuing to monitor these hot spots over time, as they grow and shrink, will allow for quick identification of concerning loss and help governments and conservation organizations better prioritize their intervention efforts.
Explore hot spots data on GFW.
Editor’s Note 08/17/2020: Blog and graphics were updated to reflect the most recent year of available tree cover loss data (2019).
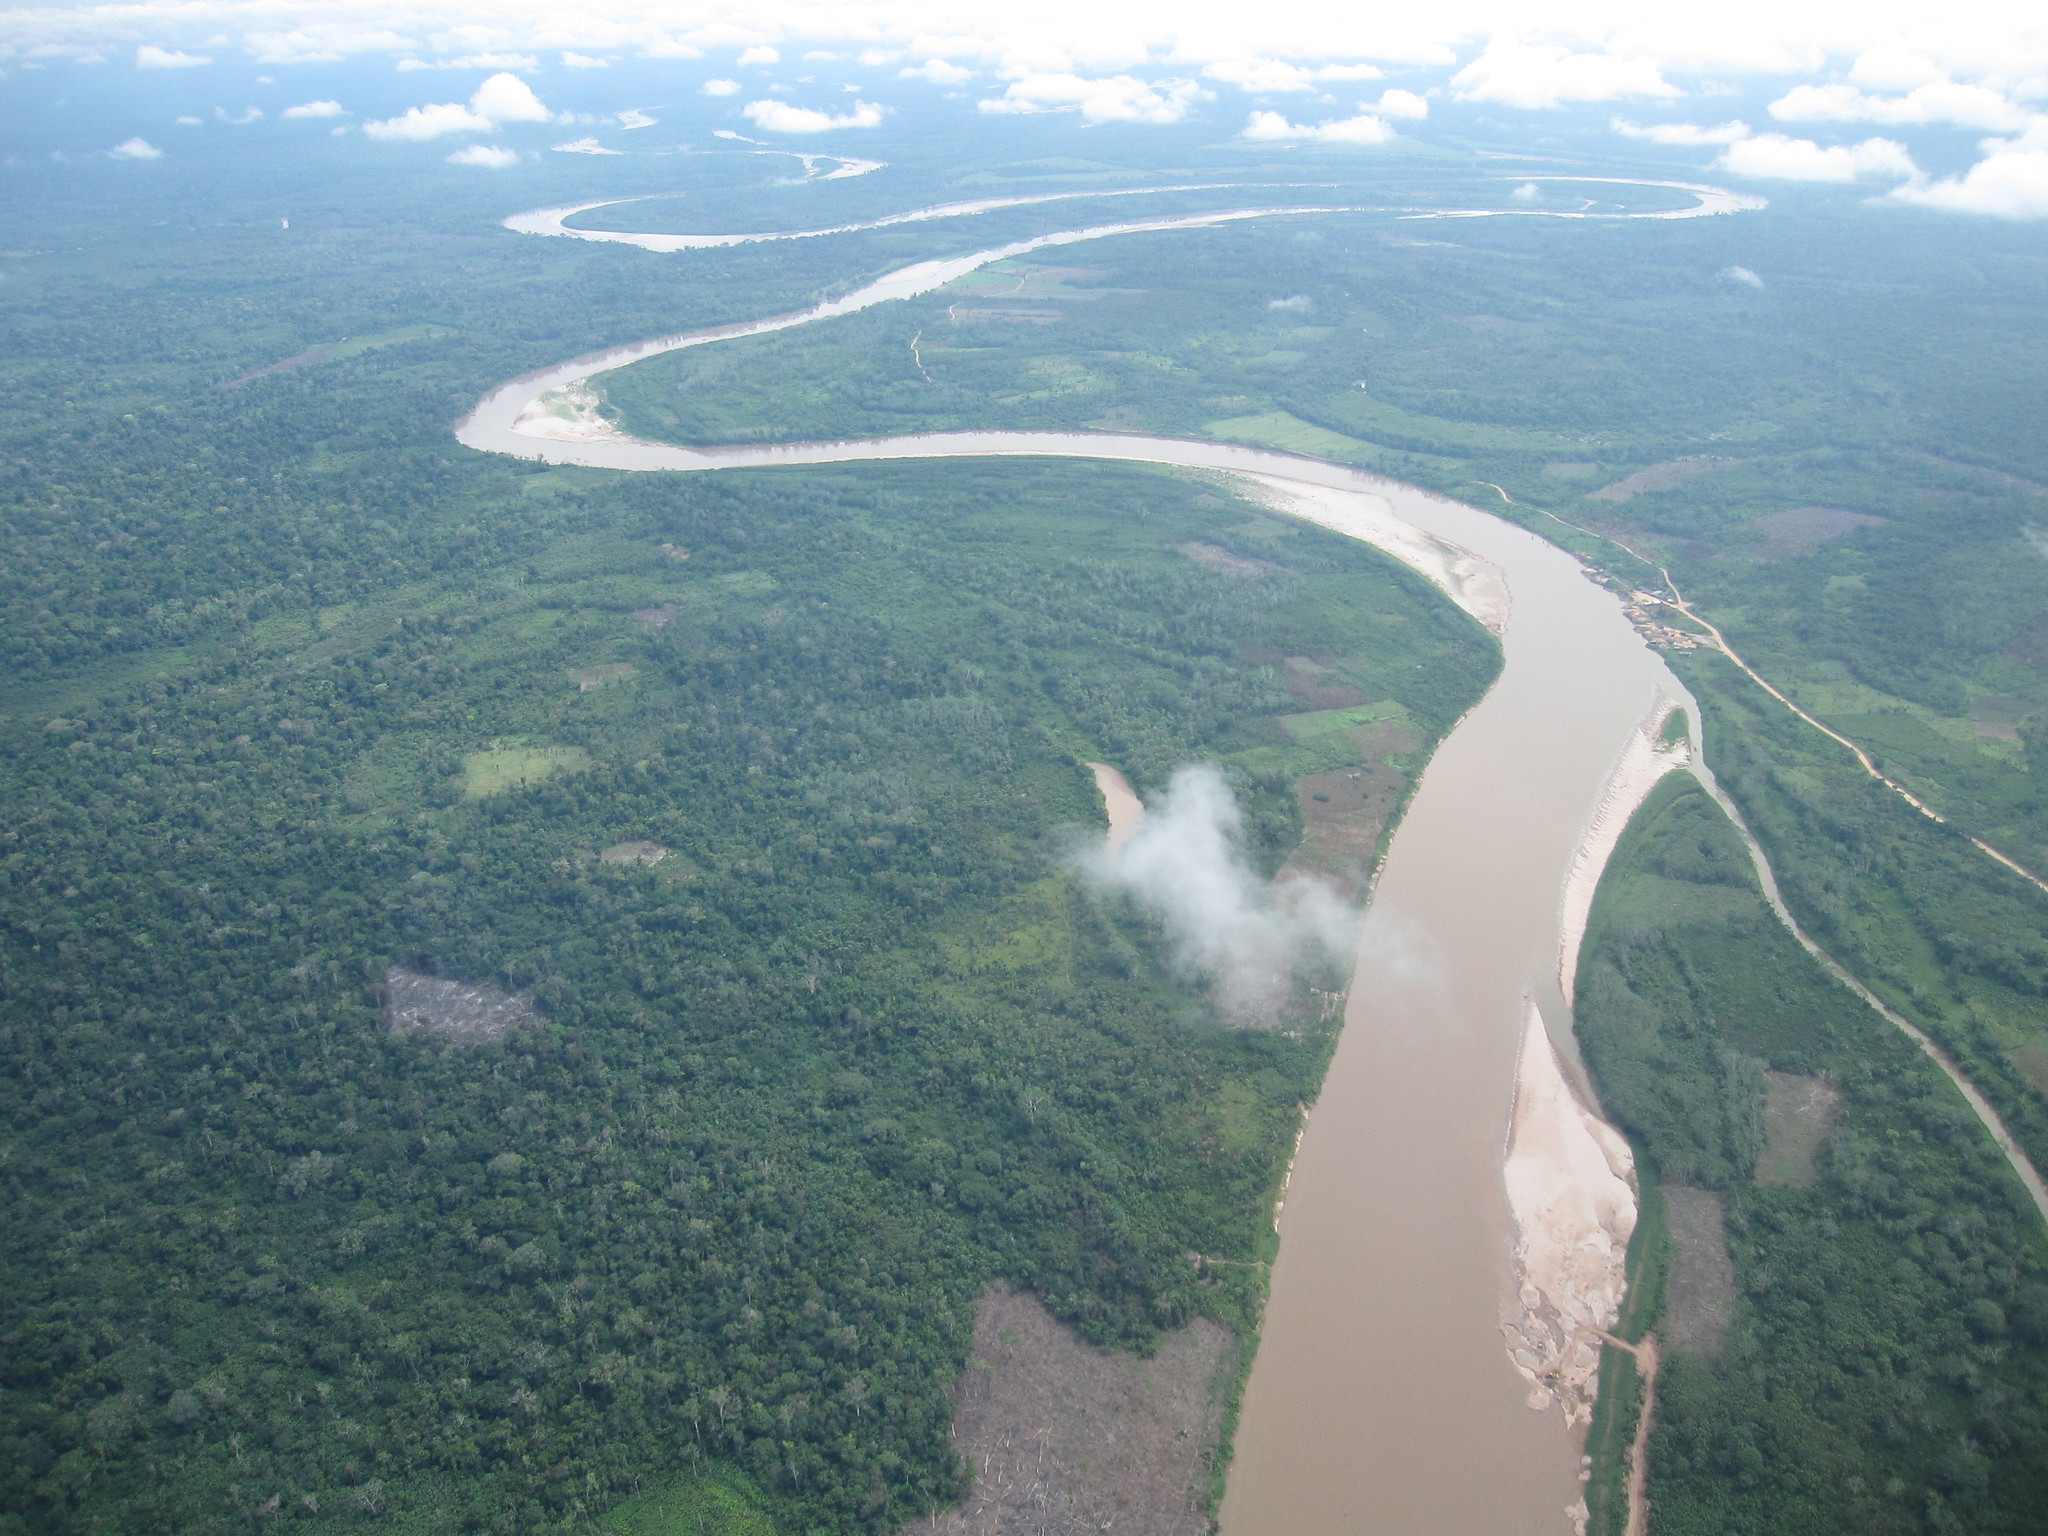
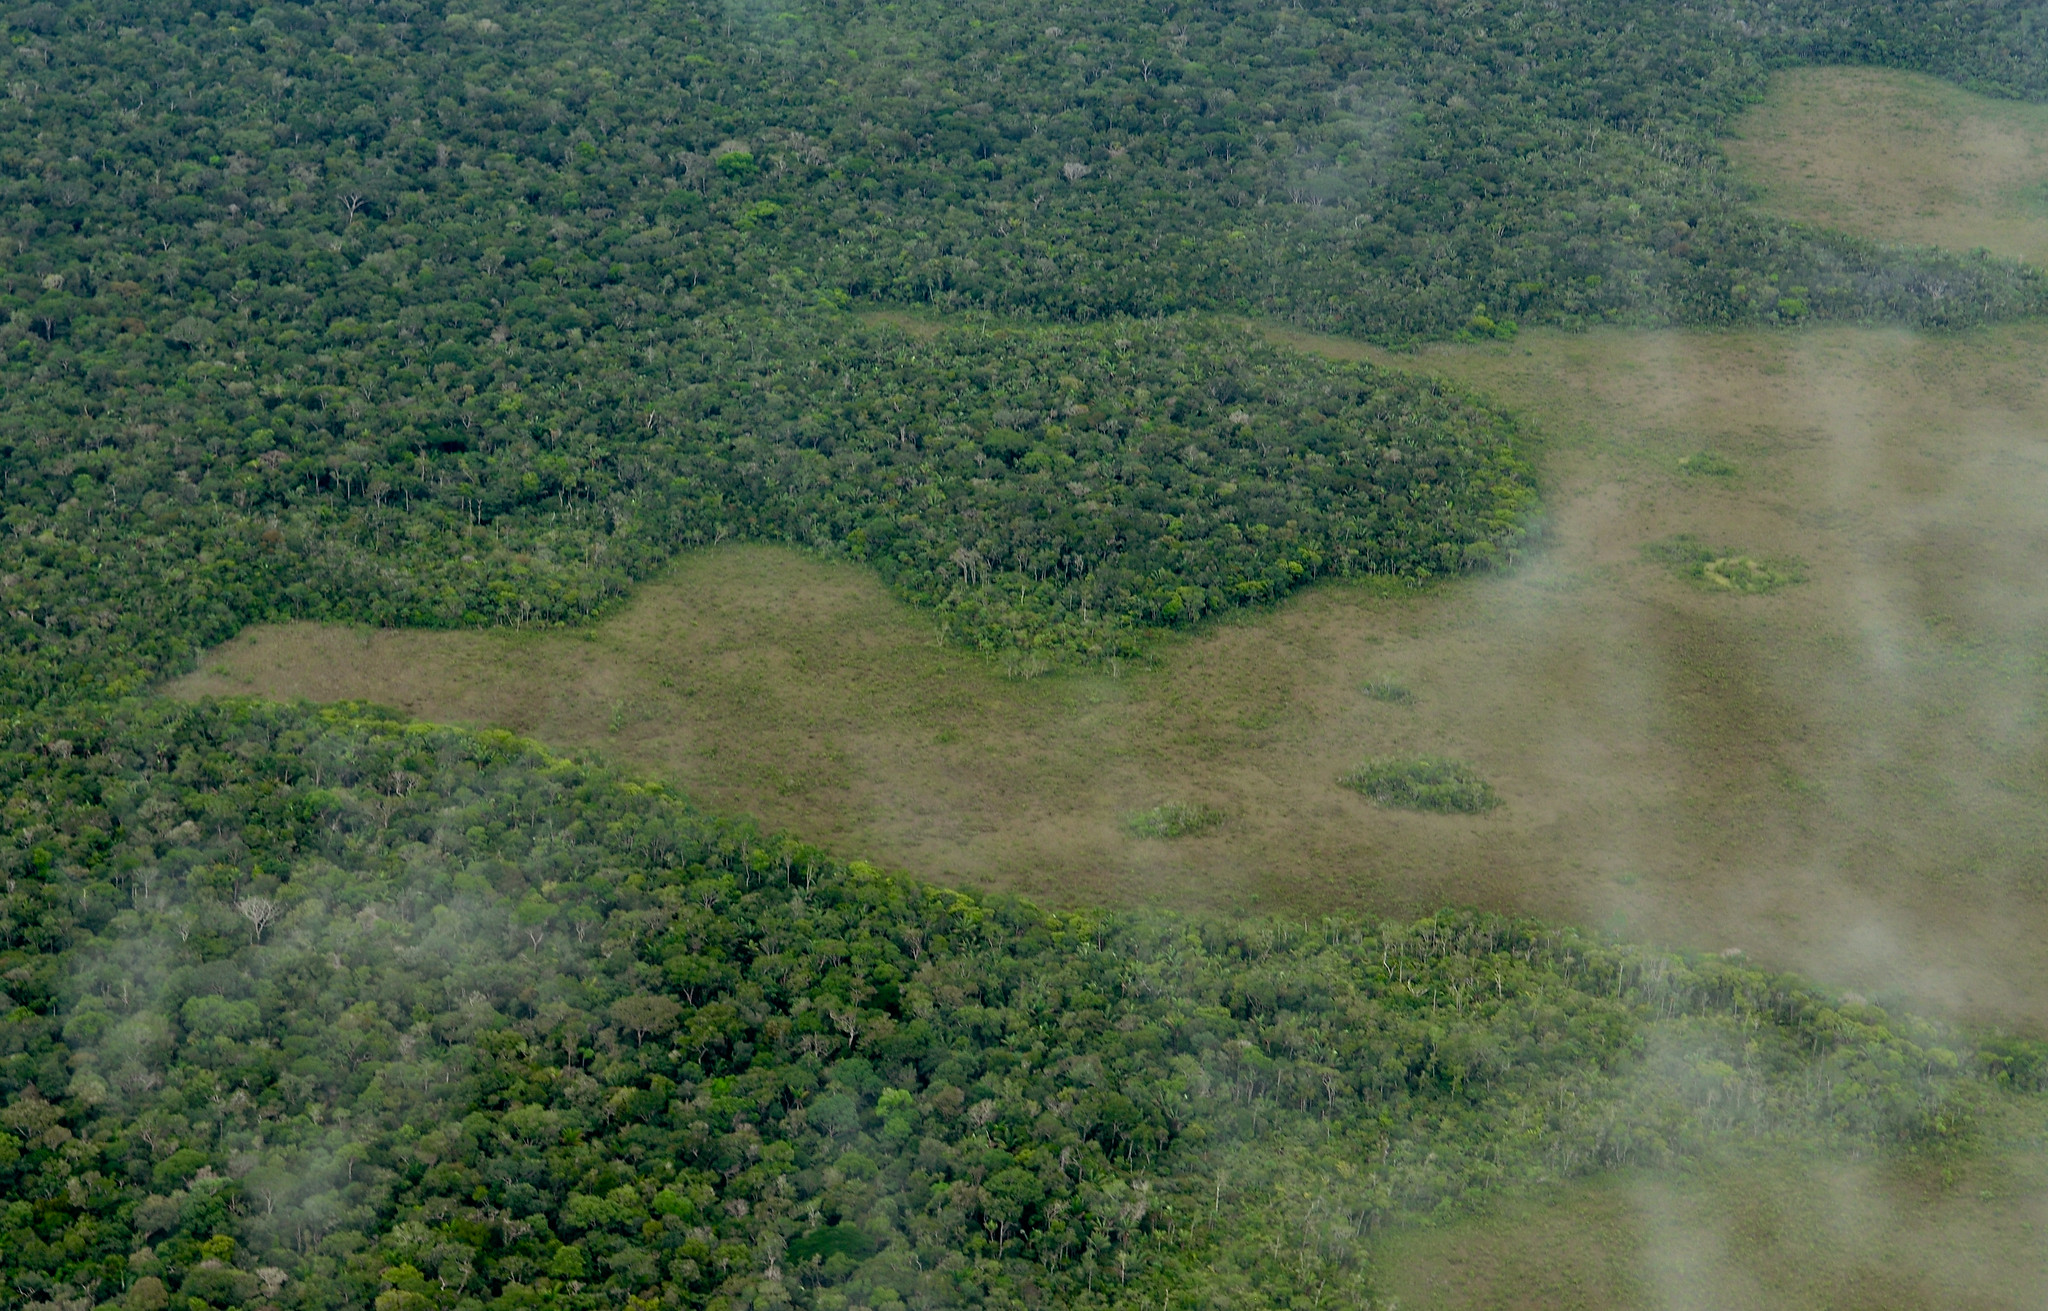
BANNER PHOTO: Flyover view of Cordillera Azul National Park in Peru, one of the few countries with diminishing hot spots. Photo by Marilu Bacigalupo/USAID.
Explore More Articles

Explore More Articles


